SkoolGrades
COMMUNITY ANALYTICS & INSIGHTS
A comprehensive analysis + report with over 200 insights revealing your Skool’s biggest strengths, weaknesses, opportunities, and threats.
How well can you answer these questions?
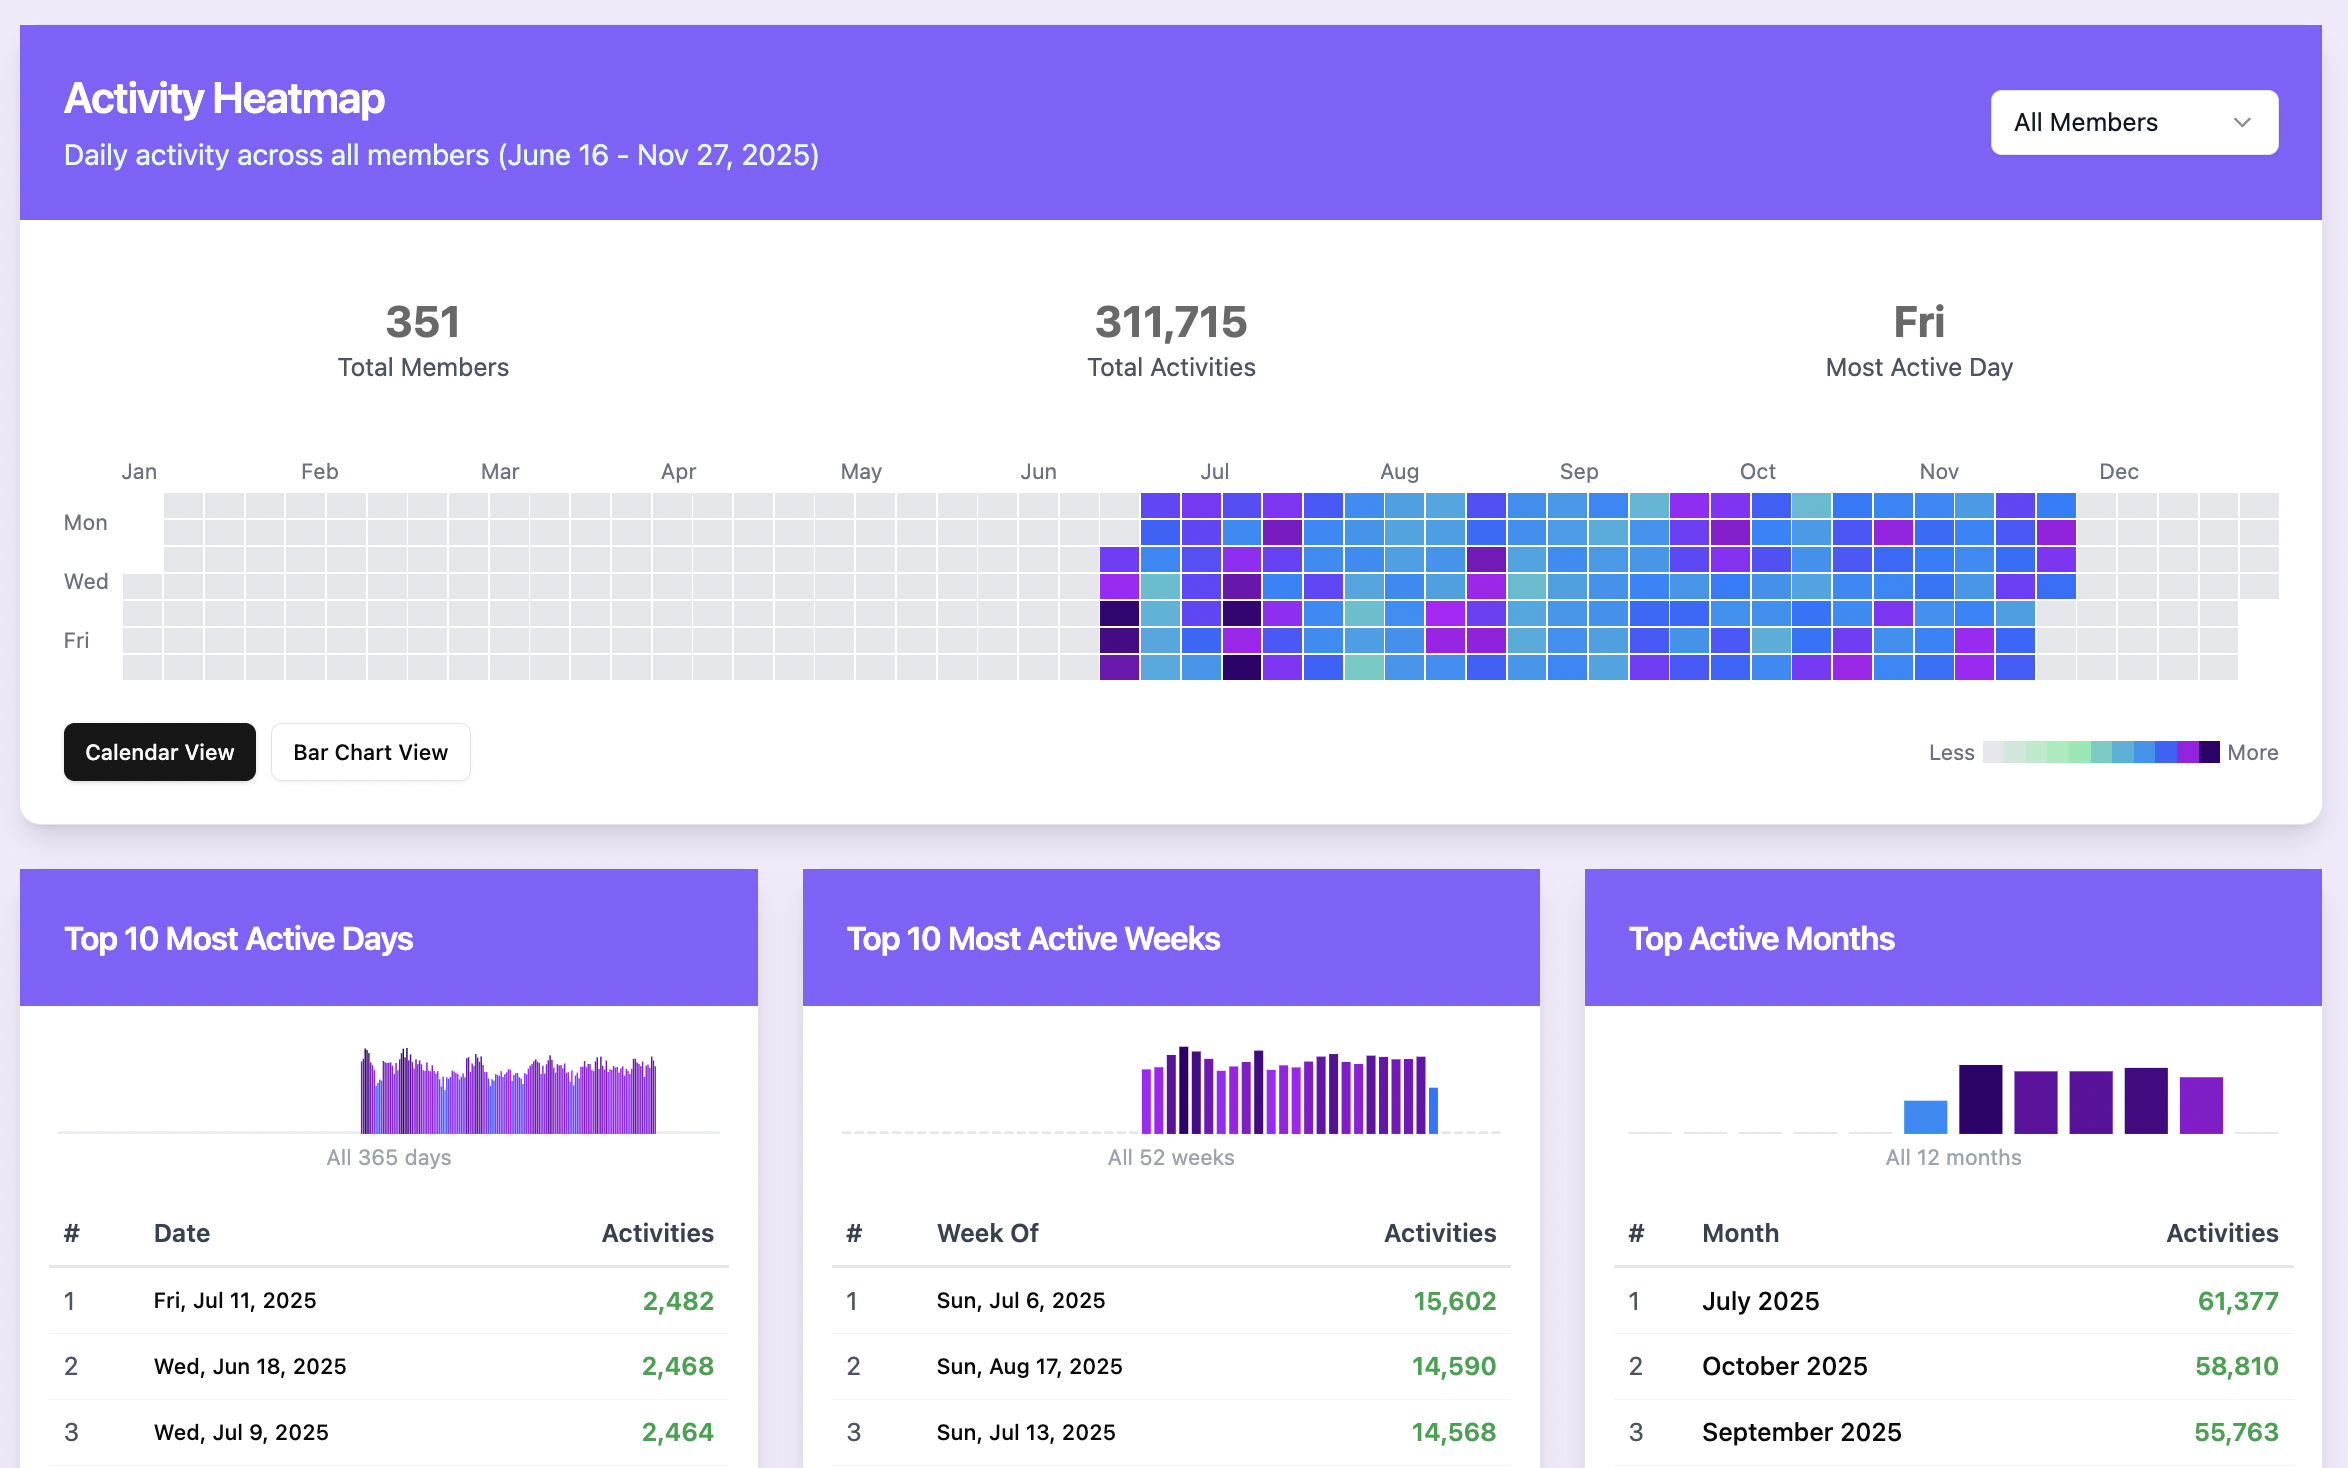
When are your members most active on Skool?
What professions, goals and pain points do they discuss most?
What is your retention rate for members who come to you from ads?
Who is new? Who is silent? Who was active, but now has stopped engaging?
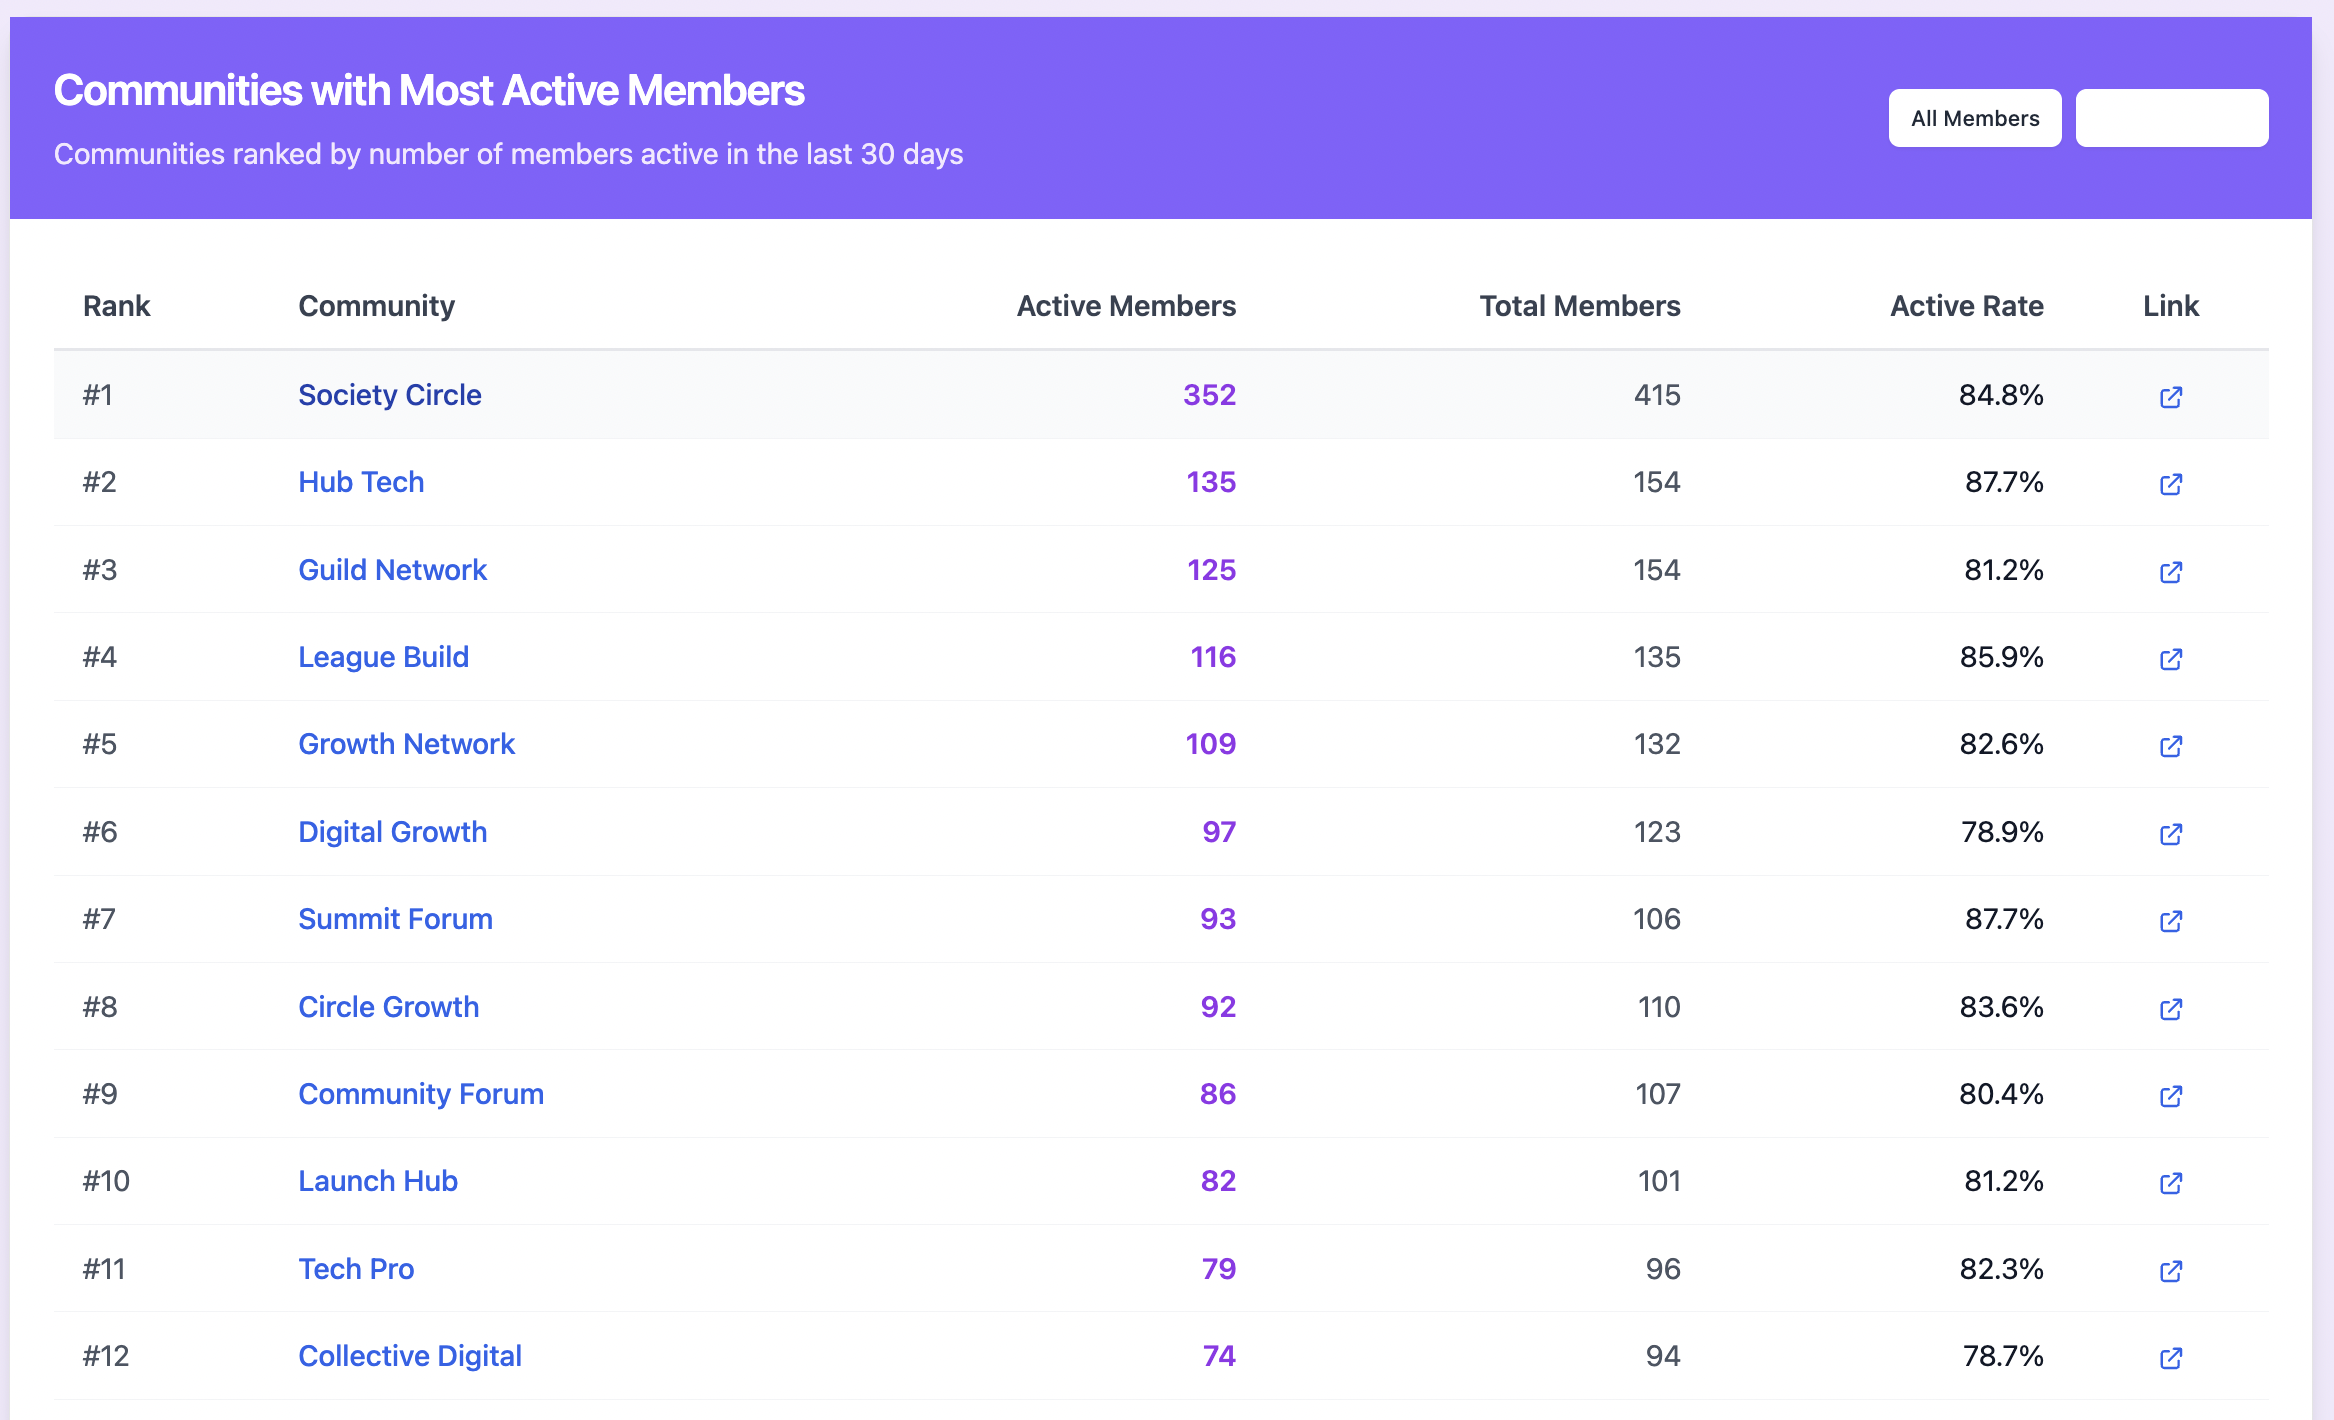
What other groups are most popular and trending with your membership?
What do these groups offer to your members?
What do other affinity groups charge for memberships?
Which affinity groups might yield the best partnerships? What can you learn from their offers?
What is your membership engagement rate?
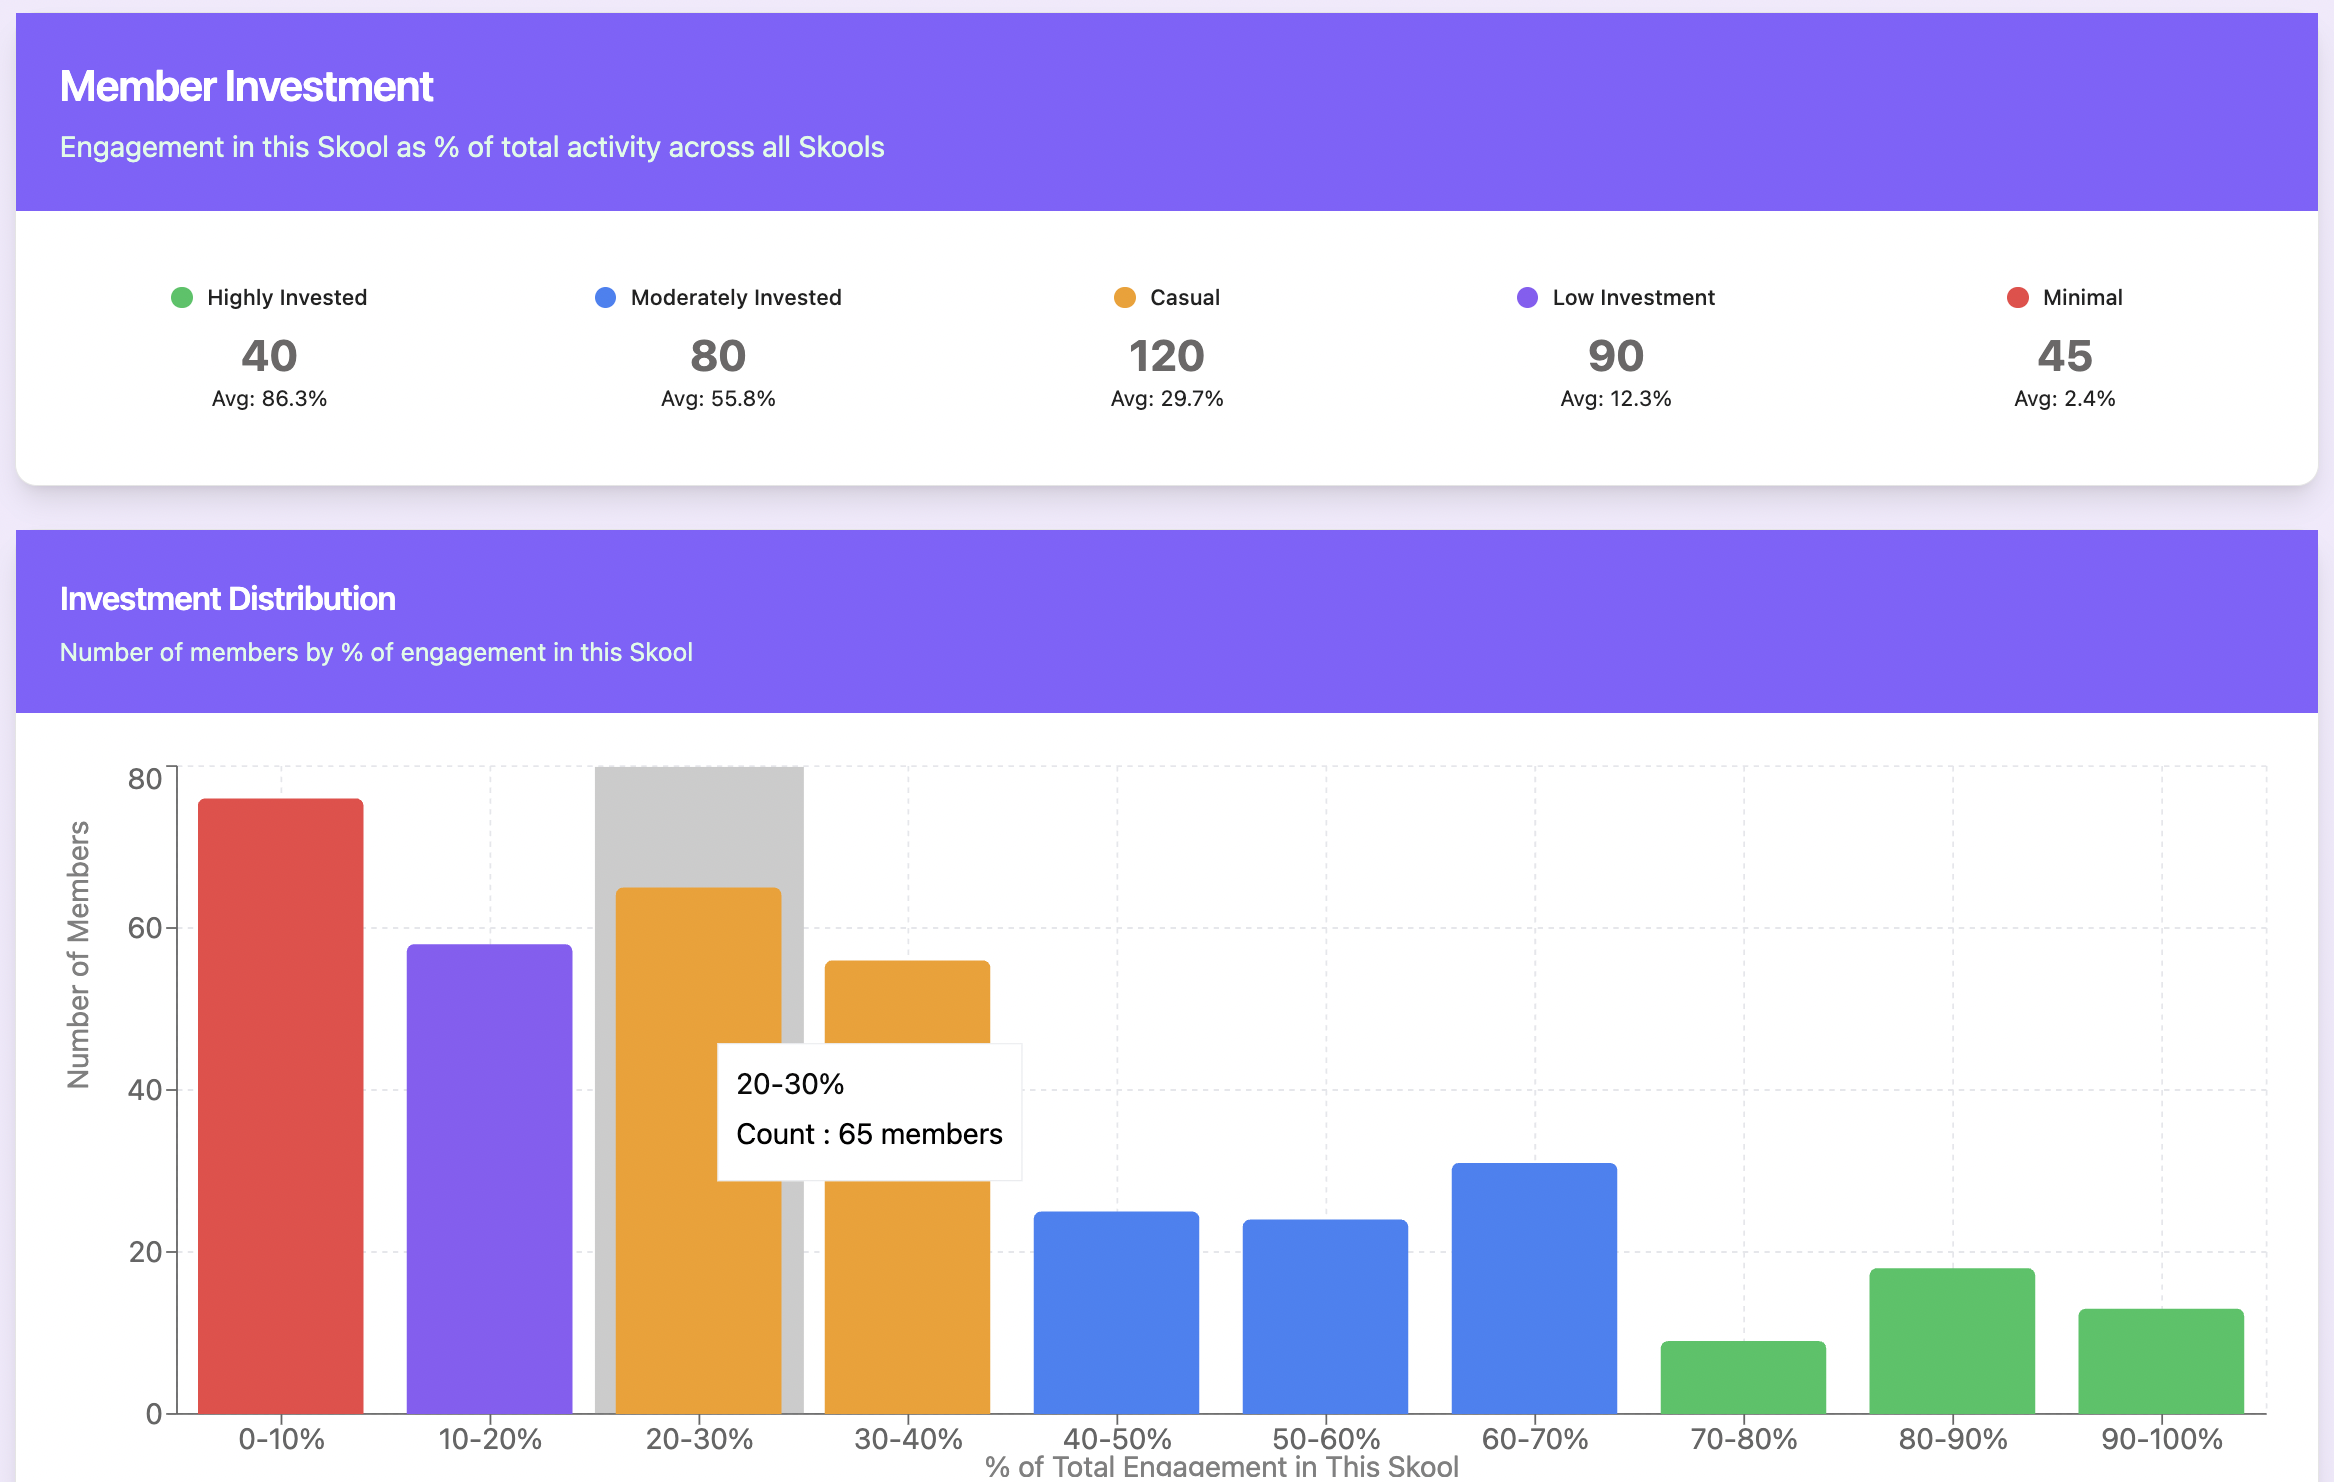
What is your share of total engagement across all groups your members join?
What are the prevailing themes that get the highest engagement?
What professions, goals and pain points do they discuss most?
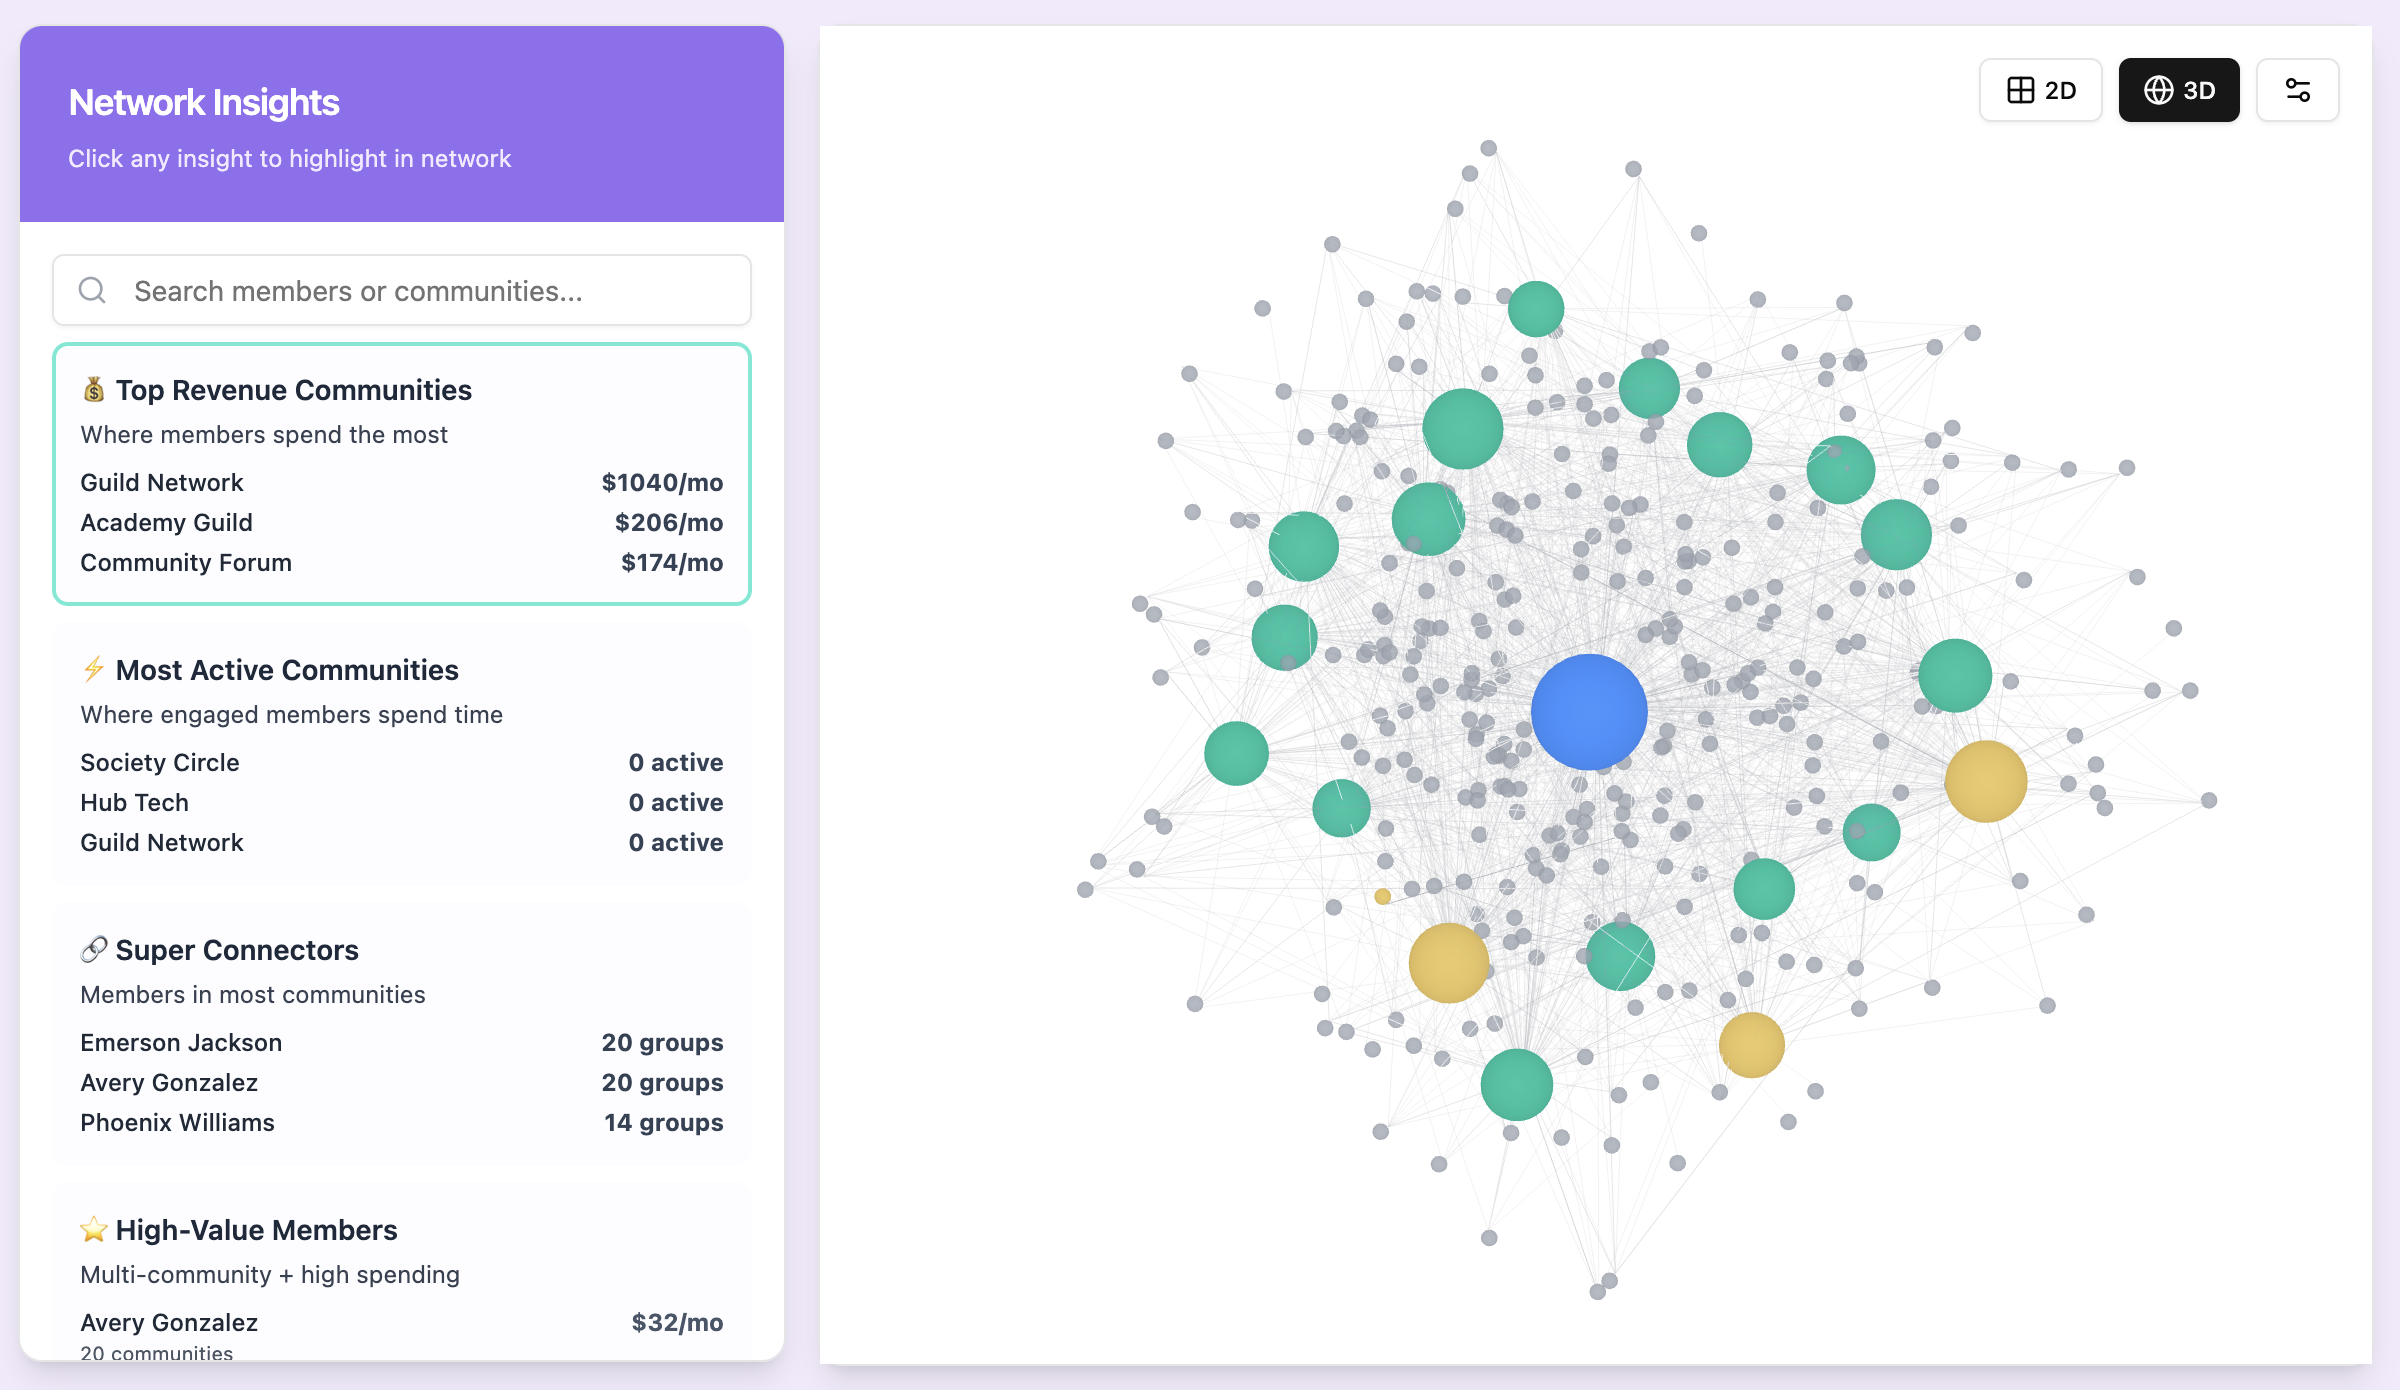
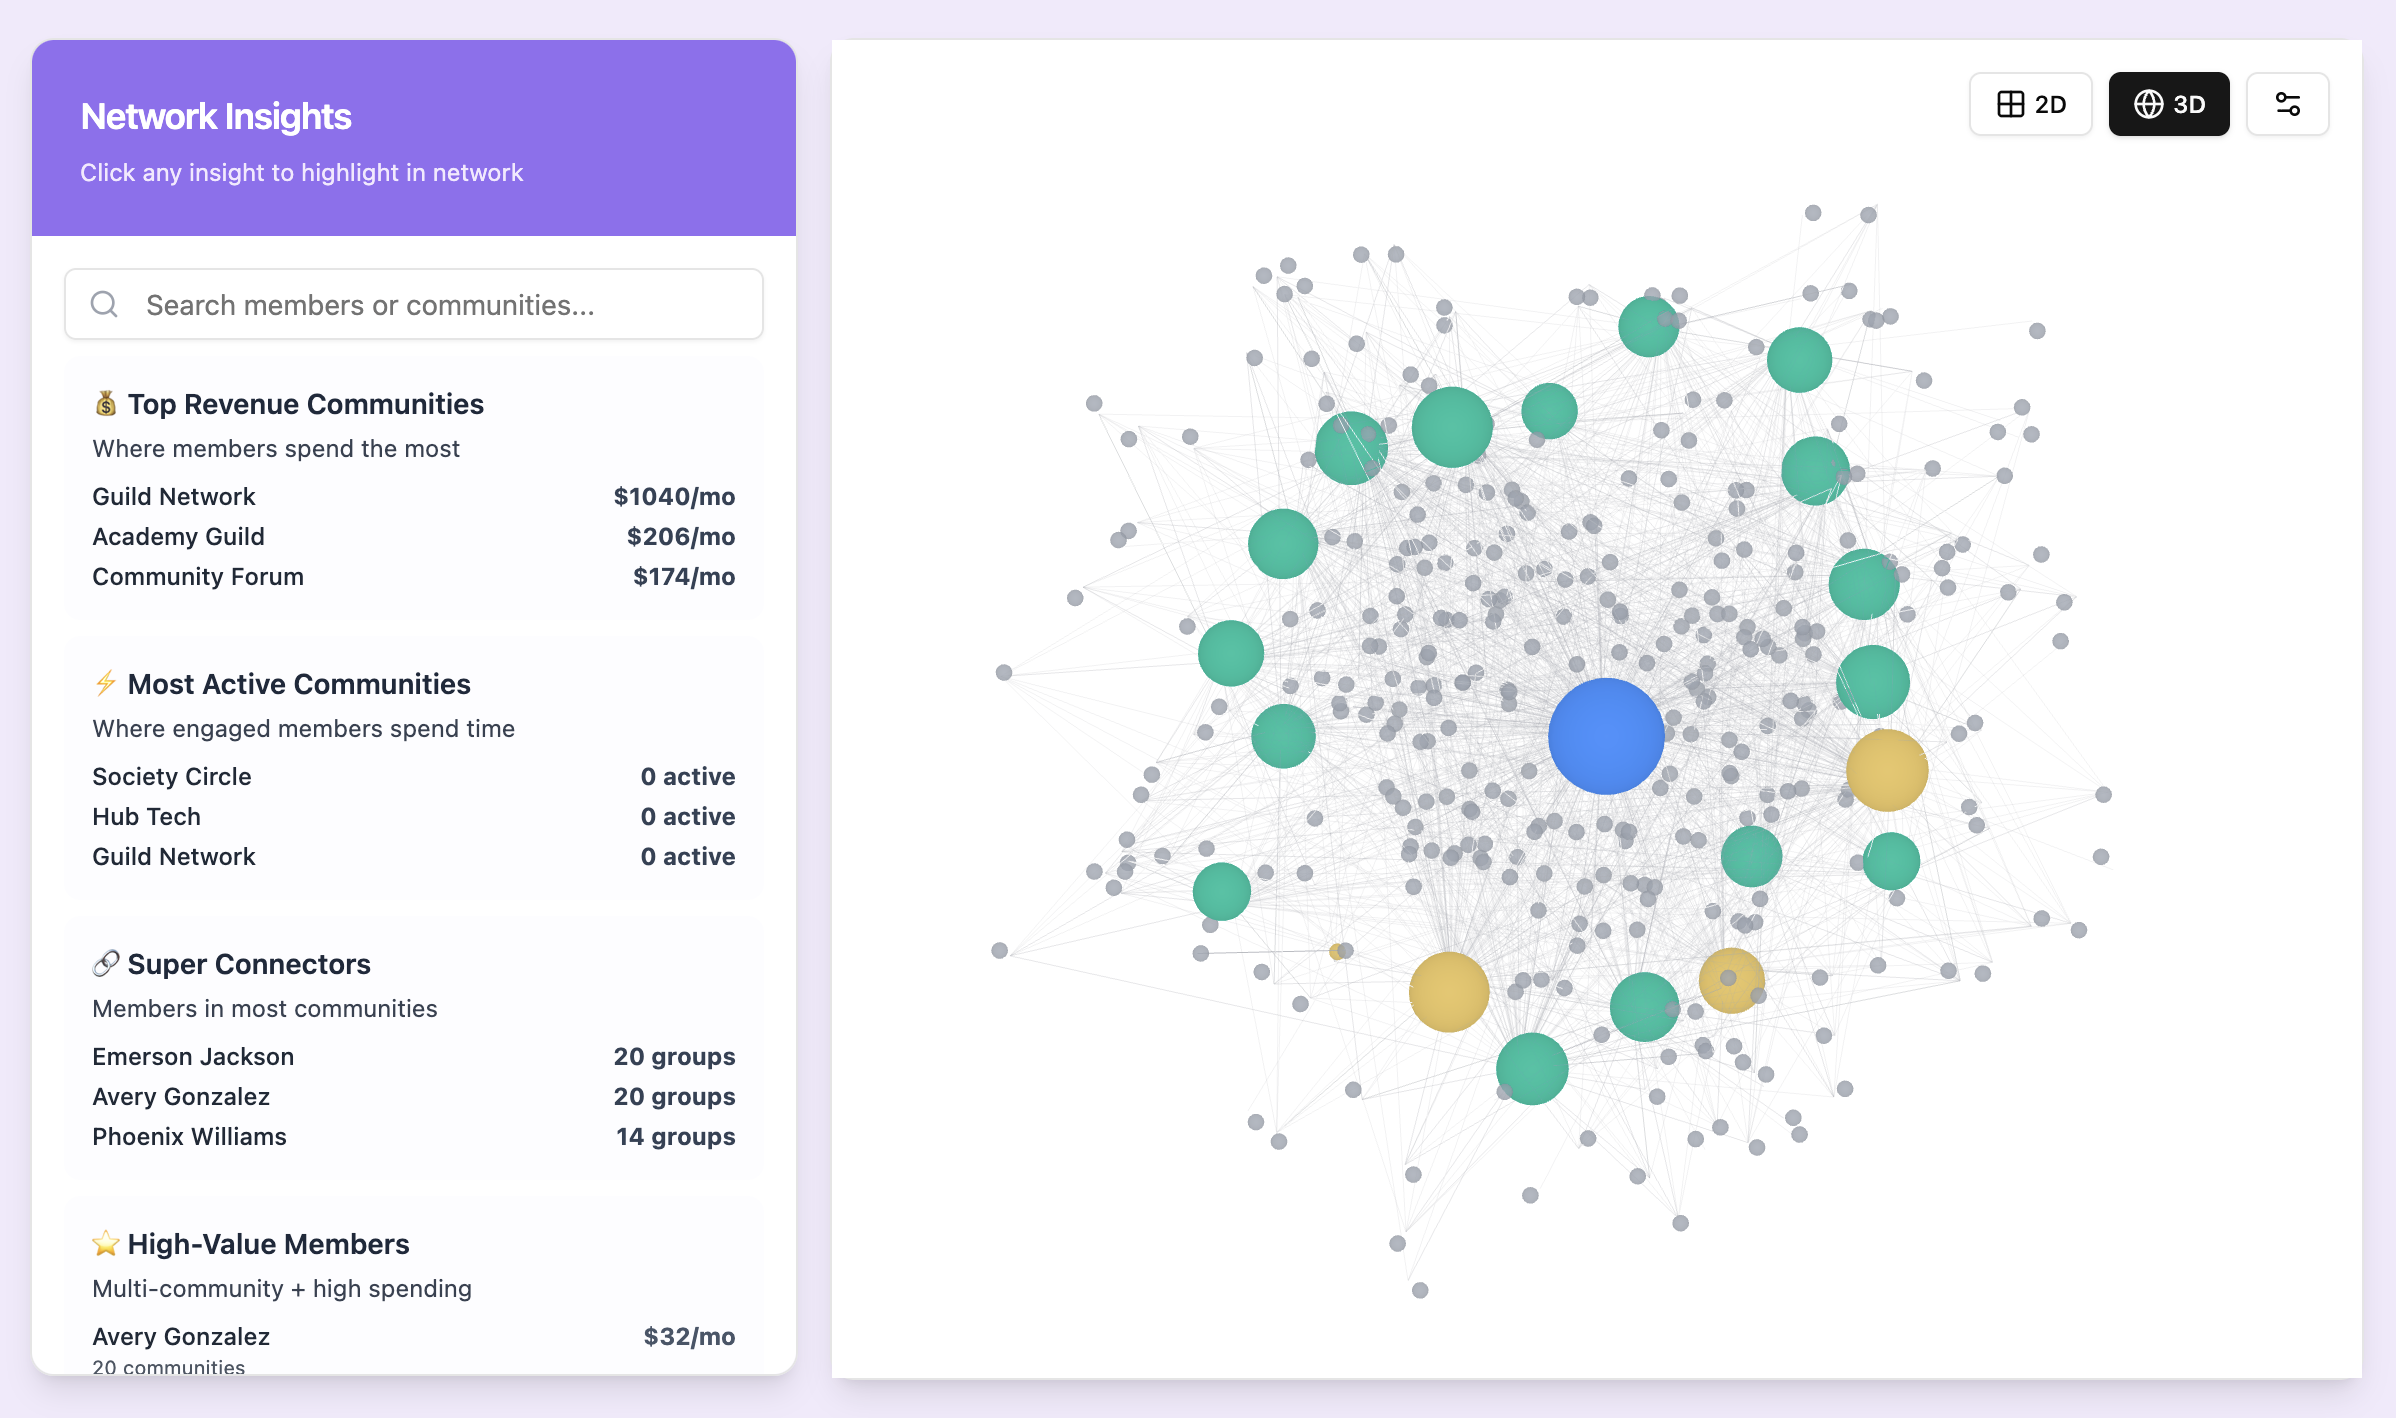
Visualize how your member connect to affinity communities
Understand the pricing models for other groups your members follow
See your membership activity and know the best days, weeks and months to post
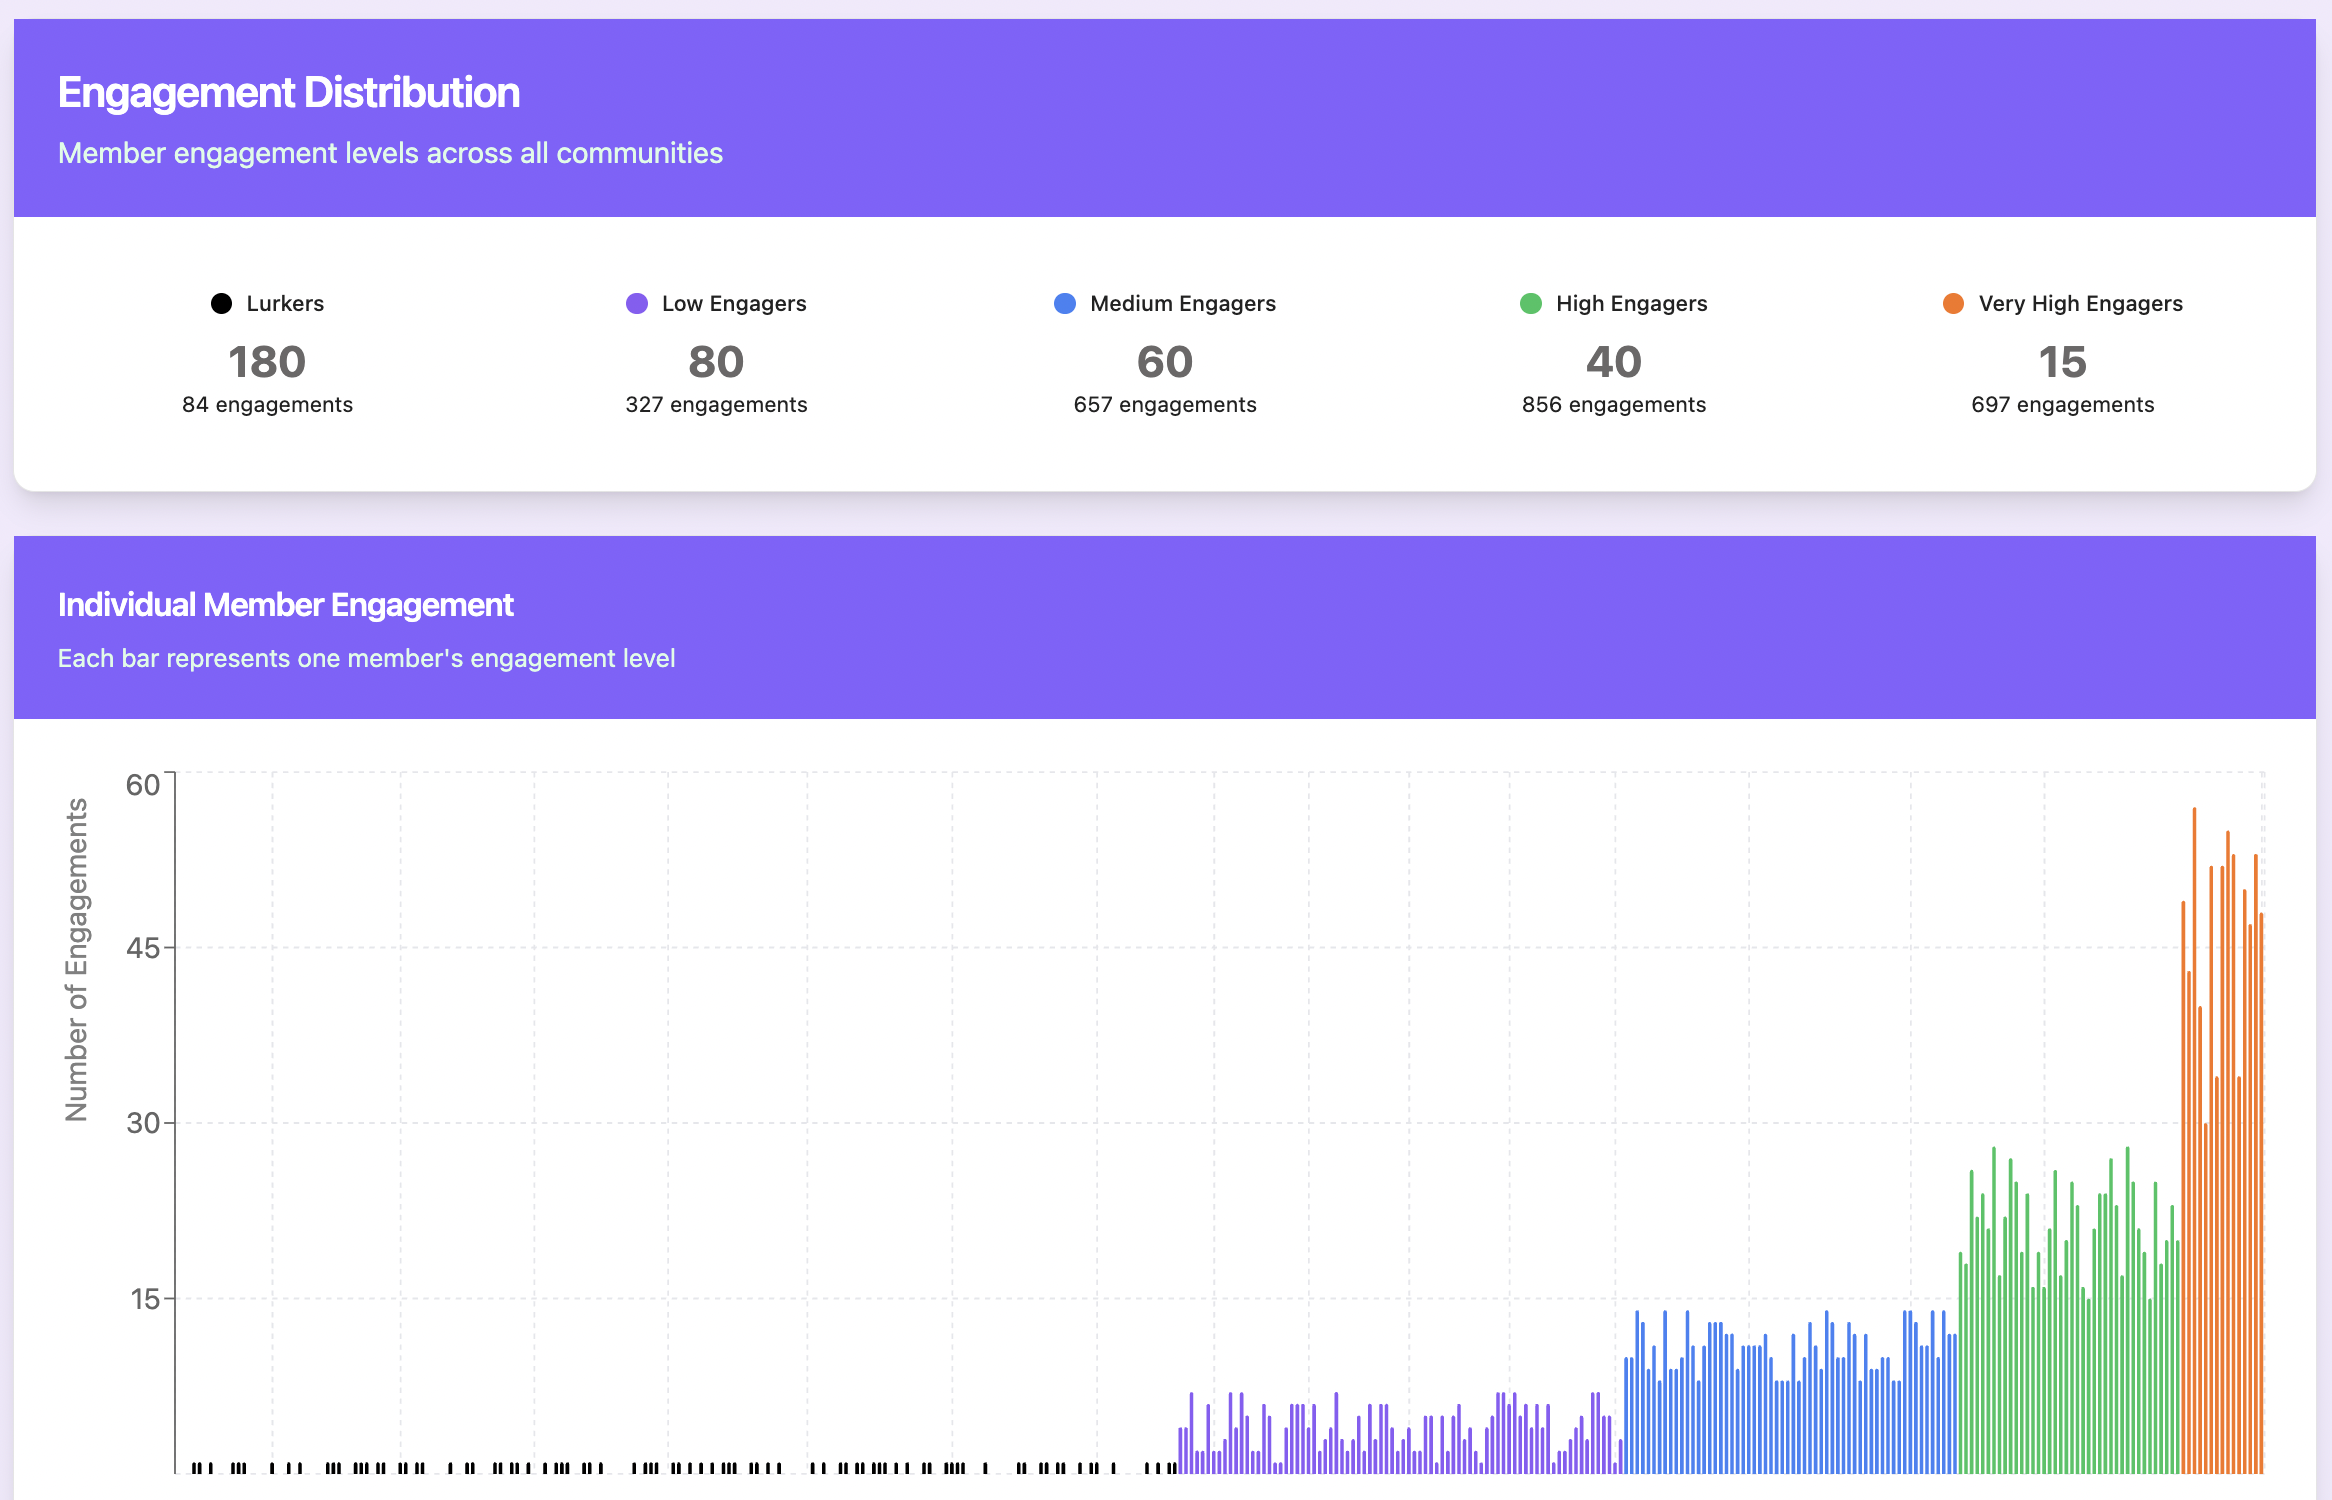
How engaged is your community, what posts engage best, and who is lurking?
What percent of your members’ total Skool engagement is spent in your group?
Understand patterns of member sentiment, profiles, pain points and goals
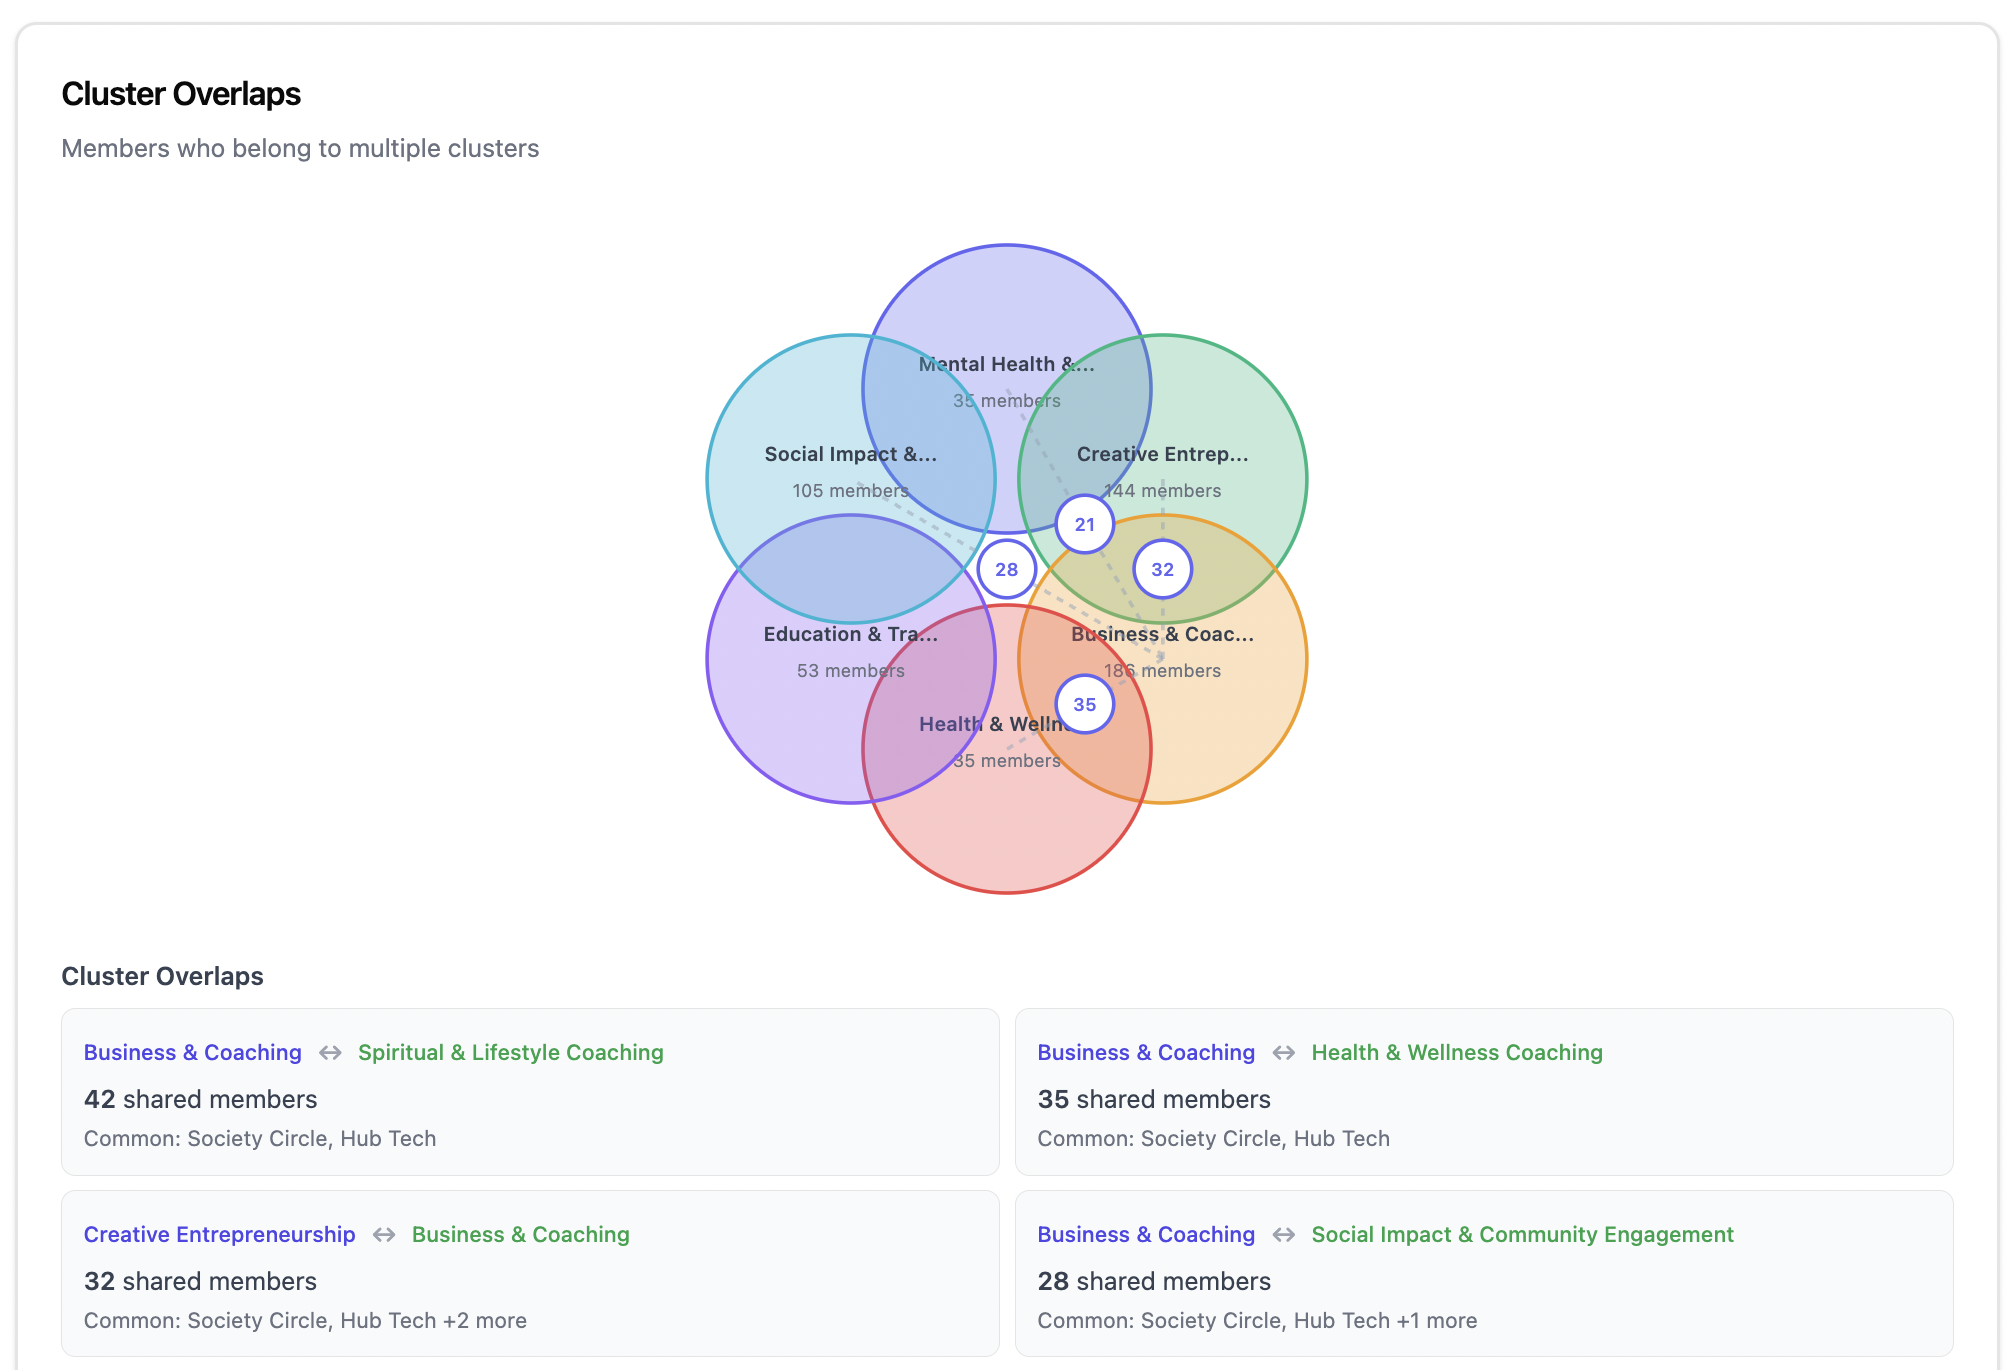
What patterns exist among the groups that your members have joined?
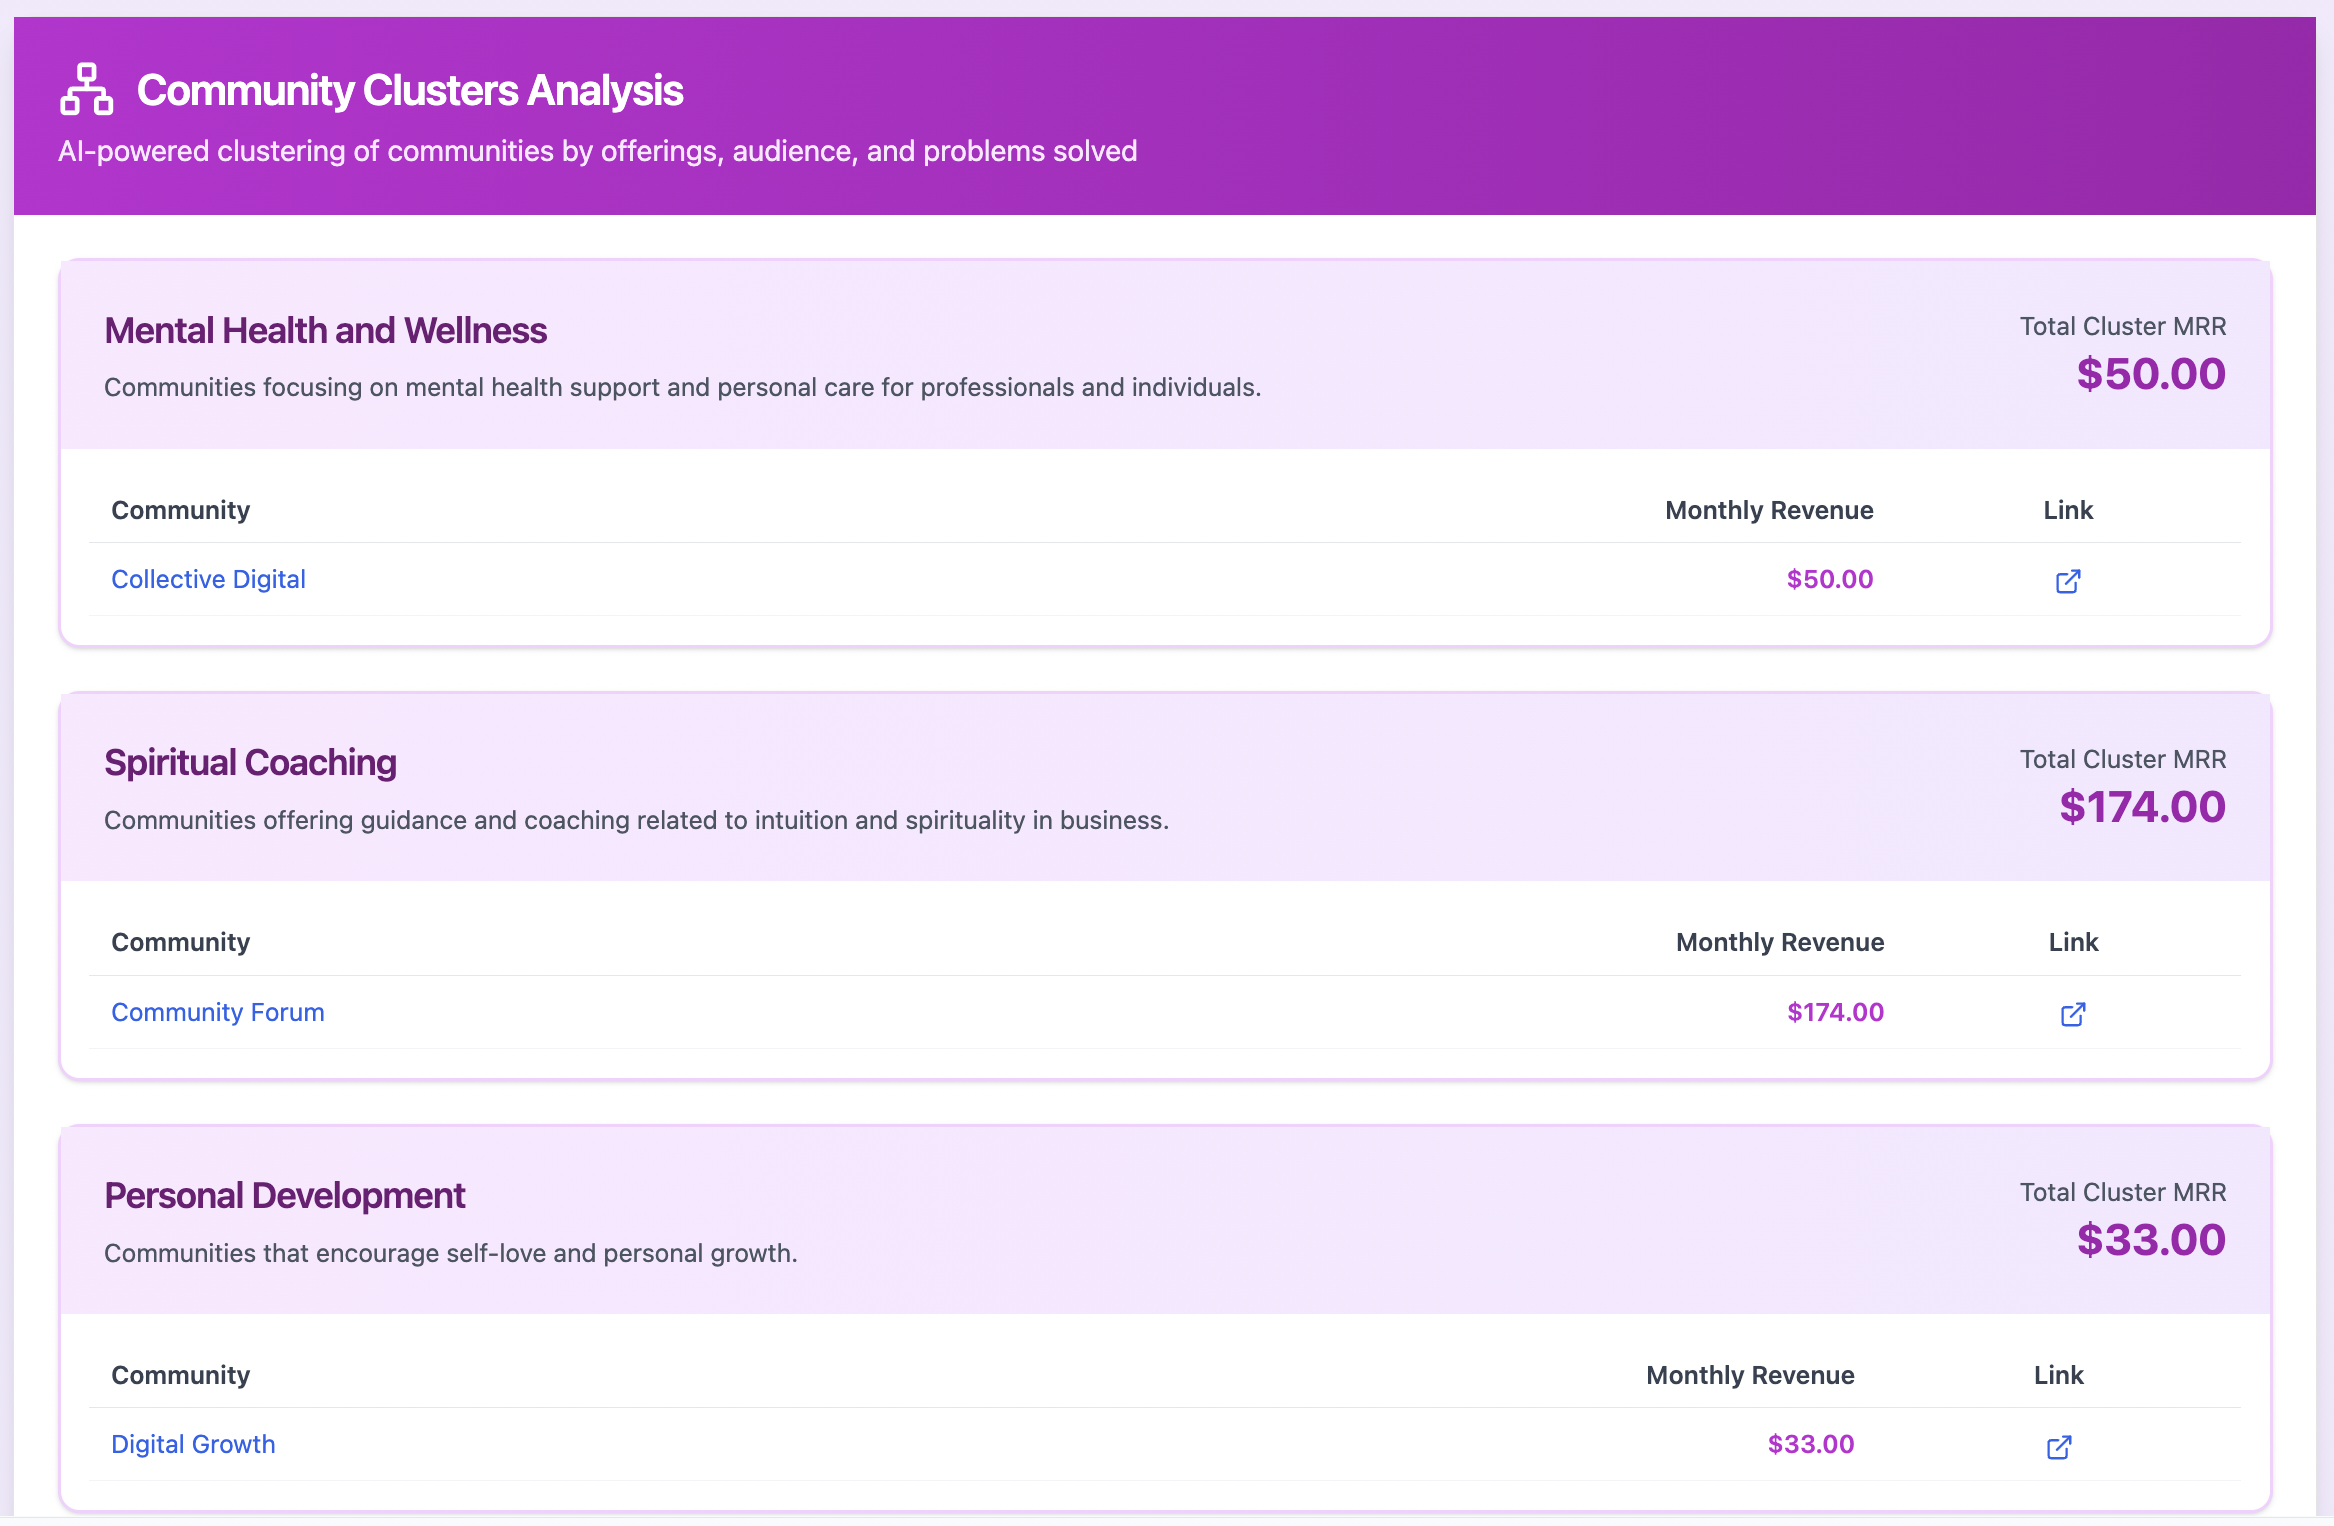
See which affinity communities your members join, their offers and pricing.
Your Skool insights are waiting.
🦋LITE
Quick dashboard view of your current membership. Export the .csv from your Skool members tab and upload it to the Lite dashboard. Free with premium membership in our Skool.
🏆FULL
Over 200 revenue-generating insights, plus a 20 page report, and comprehensive dashboard of your Skool: membership profile, community health, affinity groups, content engagement, retention, sentiment, activity and more.
Start Lite: $29
Get far more depth in your data than Skool offers. The Lite dashboard view of your current membership allows you to visualize your growth, best acquisition sources, revenue, insights and AI-driven SWOT analysis.
Browse a demo of the Lite dashboard
Lite is free with a premium membership in our Skool.
OVER 200 REPORTS INCLUDED
(IN THE Full REPORT)
GROUP INSIGHTS (Competitor Analysis)
Competition Landscape
Total competing groups: How many other communities your members belong to
Shared member count: Overlap between your group and others
Overlap percentage: What % of your members are in each competitor group
Lurker crossover: Your lurkers who are active in competitor groups
Threat level scoring: High/Medium/Low threat assessment
Competitive positioning: Where they compete with you
Group Characteristics
Group size: Total membership of competitor communities
Plan type: Free, Pro, or Hobby tier
Pricing: Monthly/annual costs
Content focus: What topics they cover (AI, Business, Community, etc.)
Value proposition: What they offer that you don't
Course offerings: Number of courses and modules
Group age: When they were created
Growth rate: How fast they're growing
Strategic Insights
Theme patterns: What topics attract your members elsewhere
Pricing patterns: What your members are willing to pay
Content gaps: What competitors offer that you don't
Strength areas: What you do better than competitors
Partnership opportunities: Groups to collaborate with
Market positioning: Where you fit in the landscape
Member Distribution Patterns
Power user groups: Groups that attract highly engaged members
High-spender groups: Where big investors congregate
Complementary groups: Non-competing communities your members join
Sequential patterns: Do members join certain groups in sequence?
Tier correlation: Do premium members join different groups than free?
CONTENT, POST & ENGAGEMENT INSIGHTS
Content Performance
Total posts: Volume of content created
Owner vs. member posts: Content dependency ratio
Owner dependency rate: How reliant community is on owner content (A-F grade)
Engagement score per post: Likes + comments weighted
Zero-engagement posts: Content that gets no response
Top performing posts: Highest engagement content
Post longevity: How long posts stay active with comments
Content Types & Patterns
Content type distribution: Question/Poll, Personal/Fun, Business, Community Building, Accountability, Tools/Platforms
Content type performance: Which types get most engagement
Value mismatch scoring: Are you posting what members came for?
Optimal content mix: Target 70% tactical, 20% community, 10% personal
Content gaps: What you should create more/less of
Topic resonance: Which subjects generate most response
Timing & Scheduling
Best posting days: Which days of week get most engagement
Best posting times: Which hours get most response
Peak activity days: Tuesday/Wednesday typically highest
Weekend drop-off: Saturday/Sunday engagement decrease
Monthly patterns: Seasonal or cyclical trends
Post frequency: How often owners and members post
Engagement Quality
Comment-to-like ratios: Depth of engagement vs. passive likes
Thread depth: How many replies per comment
Response rates: % of posts that get comments
Time to first comment: How quickly posts get response
Conversation quality: Multi-turn discussions vs. single comments
Member-to-member engagement: Direct interaction without owner
Engagement Distribution
Engagement concentration: 80/20 rule - how concentrated is activity
Top contributors: Who creates most engagement (top 10, 20, 50)
Lurker impact: Total "lost engagement" from inactive members
Active member average: Mean engagement from participating members
Engagement inequality: How evenly distributed is participation
Sentiment & Emotional Tone
Overall community sentiment: Positive/Neutral/Negative average
Sentiment by content type: Which topics generate positive reactions
Sentiment trends: Is community becoming more/less positive over time
Negative comment patterns: What triggers negative reactions
Member sentiment profiles: Are some members consistently negative/positive?
Sentiment by tier: Do paying members have different sentiment?
Post sentiment scores: Which posts have most positive comments
RETENTION & CHURN INSIGHTS
Retention Metrics
Overall retention rate: % of members not churned
Average retention days: How long members typically stay
Retention by tier: Free vs. Premium vs. VIP retention
Retention by engagement: Does engagement predict retention?
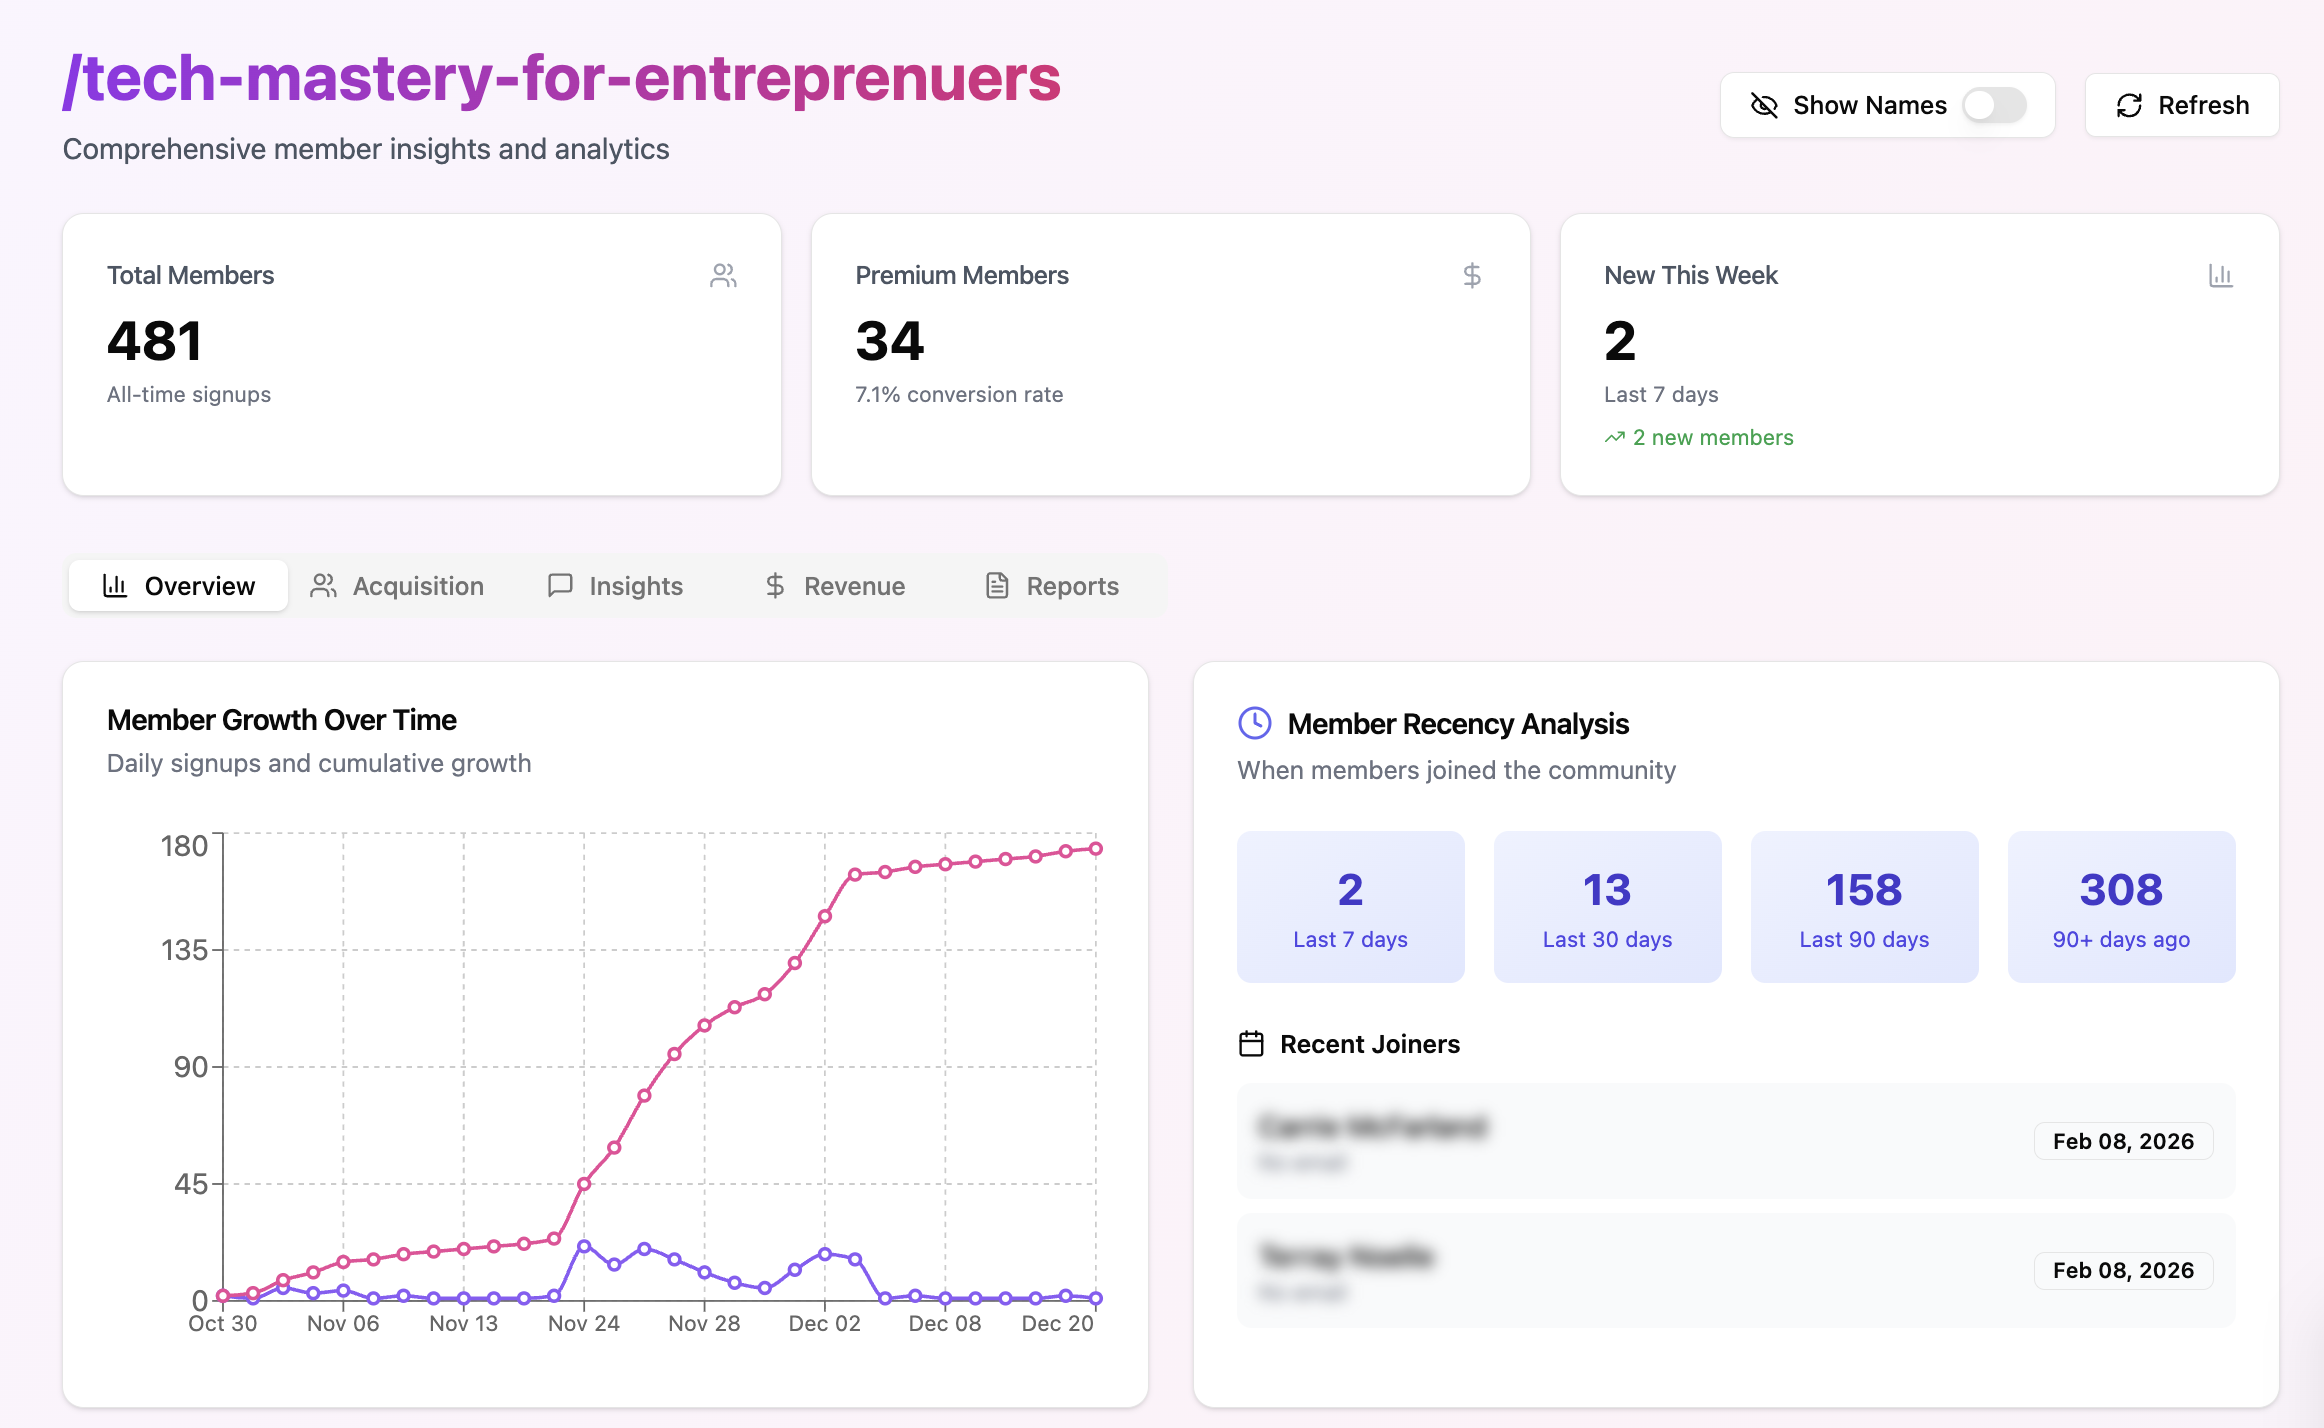
Retention curve: % still active at 30/60/90/180/365 days
New member retention: First 30-day drop-off rate
Veteran retention: 180+ day member stability
Churn Analysis
Overall churn rate: % of members who have left
Churn by tier: Which tiers churn most
Average days to churn: How long before they leave
Churn timing patterns: When do most churns happen (day 30? 60? 90?)
Churn spikes: Unusual periods of high churn
Churn by engagement level: Do active members churn differently?
Cancelling members: Those who canceled but still have access
At-Risk Identification
Churn risk scoring: High/Medium/Low risk members
Engagement decline patterns: Previously active, now declining
Activity gaps: Days since last engagement
Disengagement signals: Patterns that predict churn
Isolated members: Those in only 1-2 groups (vs. 28 average)
Low engagement + long tenure: Members who never engaged but stayed
Lifecycle Patterns
Critical drop-off points: Day 7, 30, 60, 90 analysis
Onboarding success rates: % who engage in first week/month
Path to activation: What turns lurkers into contributors
Veteran behavior: What keeps long-term members engaged
Lifecycle transitions: New → Growing → Established → Veteran patterns
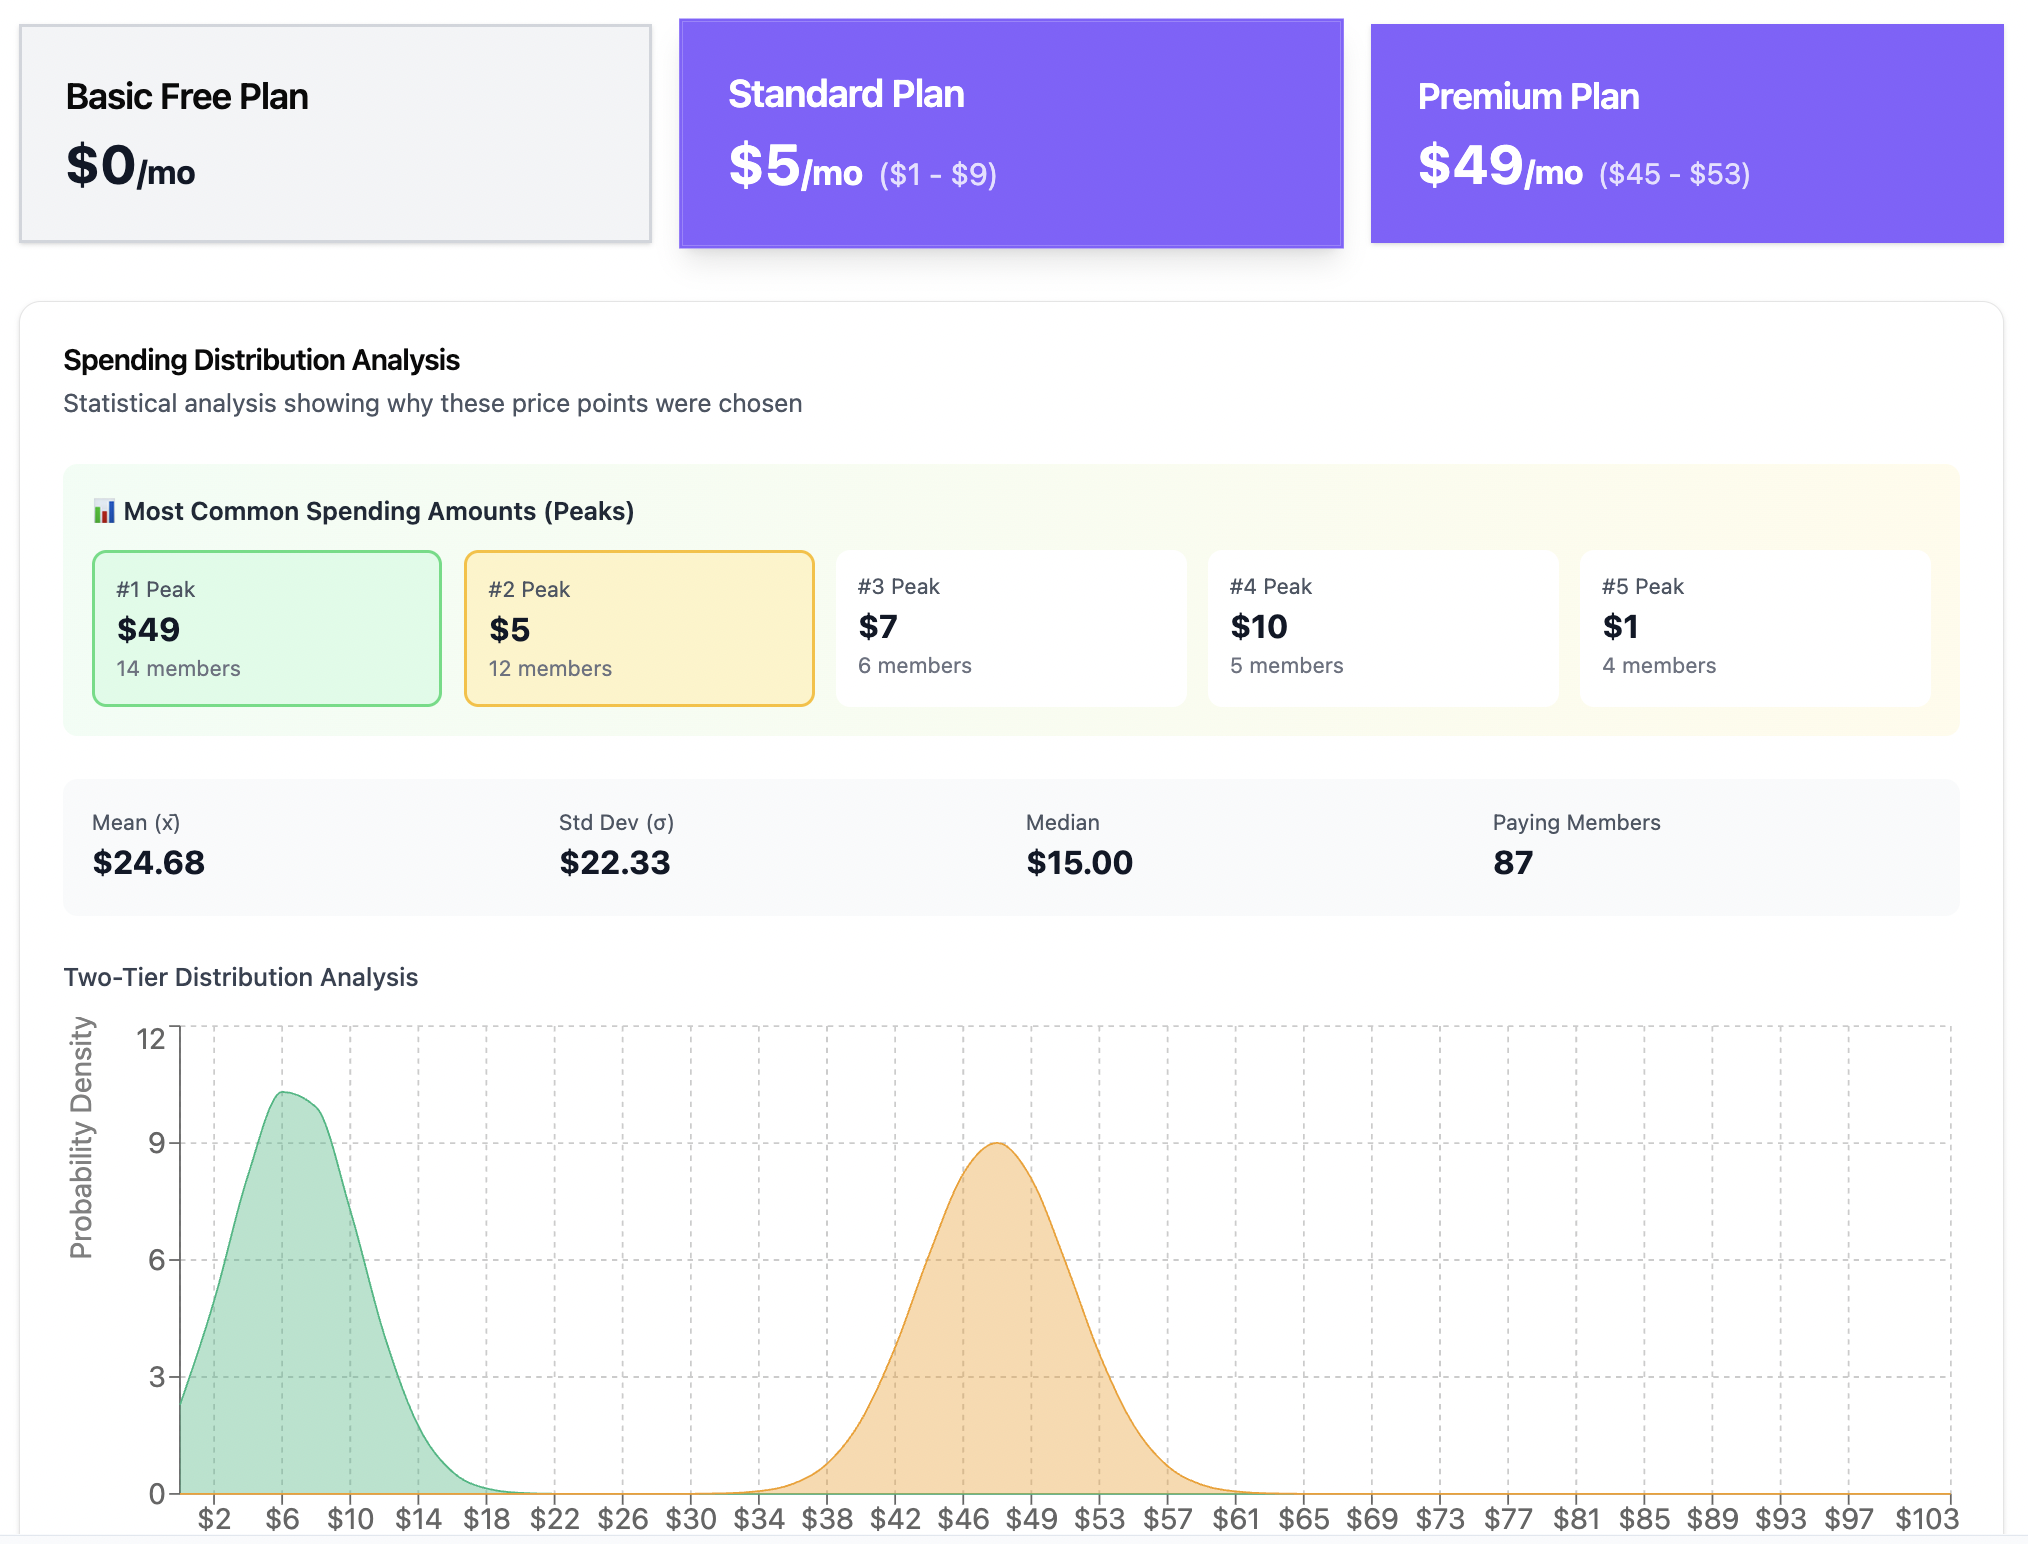
REVENUE & MONETIZATION INSIGHTS
Revenue Metrics
Total MRR (Monthly Recurring Revenue): Current monthly revenue
Total ARR (Annual Recurring Revenue): Projected annual revenue
MRR by tier: Revenue breakdown by Standard/Premium/VIP
ARPU (Average Revenue Per User): Average across all members
ARPPU (Average Revenue Per Paying User): Average from paying members only
Total LTV: Estimated lifetime value across all members
LTV by tier: Lifetime value by membership level
Tier Distribution
Tier breakdown: % Standard vs. Premium vs. VIP
Conversion rate: % of free members who upgrade
Tier engagement correlation: Do paying members engage more?
Tier retention correlation: Do paying members stay longer?
Tier churn rates: Which tiers churn most/least
Revenue Opportunities
Upgrade candidates: High-engaged free members (potential premium)
High-value members: Top revenue contributors
Revenue per engagement: Which members give most value per interaction
Undermonetized segments: Active free members in expensive groups
Expansion revenue: Members who could upgrade tiers
Cross-sell opportunities: Based on other groups they join
Pricing & Value
Member willingness to pay: Based on other group spending
Price sensitivity: Free-only vs. multi-paid-group members
Competitive pricing: What competitors charge
Value perception: Engagement vs. price paid
ROI by tier: Which tier gives best lifetime value
COMMUNITY HEALTH INSIGHTS
Overall Health Metrics
Community health scorecard: Letter grades (A-F) across dimensions
Engagement grade: Based on active member %
Retention grade: Based on average retention rate
Content grade: Based on tactical vs. personal content mix
Growth grade: Based on member acquisition trend
Owner dependency grade: Based on owner content %
Overall grade: Weighted average of all dimensions
Growth & Momentum
Total members: Current community size
Growth rate: Monthly member acquisition
Growth phases: Slow/Steady/Rapid growth periods
Peak growth month: When you added most members
Growth projections: Next 1/3/6 month predictions
Acquisition trends: Which sources are growing/declining
Activity & Vibrancy
Active member percentage: % with any engagement
Average engagement per member: Mean activity level
Total community engagements: Sum of all activity
Activity concentration: Is activity evenly distributed?
Peak activity times: When community is most alive
Activity trends: Growing, stable, or declining
Community Balance
Lurker percentage: % with zero engagement (the "problem")
Active lurker count: High-priority activation targets
Member-to-owner ratio: Content creation balance
Engagement inequality: How concentrated is participation
Diversity of voices: How many members contribute
Community self-sufficiency: Can it run without owner?
Weekly & Monthly Rhythms
Weekly activity patterns: Best/worst days
Monthly activity patterns: Seasonal trends
Holiday impacts: Christmas, New Year drops
Campaign effects: Spike analysis from initiatives
Consistency: Stable vs. volatile engagement
OPPORTUNITIES & ACTION INSIGHTS
High-Priority Targets
Active Lurkers list: 1000+ Skool activity, 0 in your group
Potential engagement: Total "lost" activity that could be captured
Activation candidates: 100-999 activity elsewhere
Re-engagement targets: Previously active, now declining
Upgrade candidates: Highly engaged free members
Activation Strategies
Low-hanging fruit: Recently joined, moderately active elsewhere
High-potential targets: 500-999 activities, few groups
Quick win opportunities: Members who could activate quickly
Pain point alignment: Members whose challenges you solve
Goal alignment: Members whose goals match your content
Recognition & Showcases
Member spotlight candidates: Great stories to feature
Top contributors: Leaders to recognize publicly
Success stories: Transformations to highlight
Community champions: Advocates to nurture
Testimonial sources: Members for social proof
Content Opportunities
Most-requested topics: From pain points and goals
Content gaps: What members need that you don't provide
High-performing formats: Types to create more of
Low-performing content: Types to reduce
Competitive gaps: Topics competitors cover that you don't
Value mismatch fixes: Align content with member expectations
Partnership & Collaboration
Complementary groups: Non-competing communities to partner with
Cross-promotion opportunities: Groups with shared audiences
Guest expert sources: From members' other groups
Co-marketing opportunities: Based on shared members
Referral partnerships: Groups that refer to each other
Risk Mitigation
At-risk members: High churn risk to contact
Declining engagement: Members to re-engage
Competitor threats: Groups stealing your members' attention
Content dependency: Over-reliance on owner posts
Engagement concentration: Over-dependence on few contributors
Churn spike investigations: Why did X members leave in December?
PROFILE & DEMOGRAPHIC INSIGHTS
Professional Background
Industry distribution: What fields members work in
Experience levels: Beginner, intermediate, advanced
Business stage: Startup, scaling, established
Role types: Founder, marketer, consultant, employee
Tech savviness: Comfort level with technology
Pain Points & Challenges
Top 5 challenges: Most common problems (from survey Q2)
Pain point themes: Categories of struggles
Technical challenges: Specific tech barriers
Resource constraints: Time, money, knowledge gaps
Implementation struggles: Knowing vs. doing gaps
Overwhelm patterns: Too many options, don't know where to start
Goals & Aspirations
Primary goals: What they want to achieve (from survey Q3)
Goal themes: Common ambitions
Success definitions: What winning looks like to them
Timeline urgency: Quick wins vs. long-term goals
Transformation desired: Before/after states
Segment-Specific Patterns
Standard member profile: Common traits of free members
Premium member profile: What paying members look like
VIP member profile: Characteristics of top tier (if any)
Active member profile: What engaged members have in common
Churned member profile: Patterns among those who left
Active Lurker profile: High Skool activity, zero in your group
COMPARATIVE & BENCHMARK INSIGHTS
Series Comparison (Time-Based)
Member growth: How many added between uploads
Engagement changes: Increase/decrease in activity
New lurkers identified: Fresh activation opportunities
Activated lurkers: Success stories
Churn changes: Who left between series
Content performance shifts: What's working better/worse
Sentiment changes: Community becoming more/less positive
Segment Comparisons
Free vs. Paid: Behavior differences by tier
Active vs. Lurkers: Engagement pattern differences
New vs. Veterans: Lifecycle behavior differences
High-spend vs. Low-spend: Investment correlation with behavior
Multiple groups vs. Few groups: Loyalty patterns
Active Lurkers vs. Active Contributors: Why do some engage here, others don't?
Competitive Benchmarks
Your position: Where you rank vs. competitors
Pricing position: Premium, mid-market, or budget
Size comparison: Larger/smaller than competitors
Engagement comparison: More/less engaged than similar communities
Retention comparison: Industry standards vs. yours